
Application Note
Deep Learning-based Image Analysis for Label-free Live Monitoring of iPSC and 3D Organoid Cultures
- Get robust image segmentation of label-free images with automated deep learning tools
- Customize deep learning segmentation models to detect complex objects of interest with minimal human intervention using SINAP
- Perform data classification easily with intuitive machine learning phenoglyphs tool
Angeline Lim, PhD | Applications Scientist | Molecular Devices
Misha Bashkurov, PhD | Product Owner | Molecular Devices
Oksana Sirenko, PhD | Sr. Scientist | Molecular Devices
Introduction
Complex 3D biological models such as organoids and patient-derived spheroids are gaining popularity in many biomedical research areas because they more closely recapitulate the in vivo tissues. These 3D models offer huge potential in disease modeling, drug screening, toxicity studies, host-microbe interactions, and precision medicine.1 In order to use organoids for large scale screens, automation is instrumental to handle the massive amount of sample, and culture more consistent and reproducible iPSC lines and their derived organoids.
A major requirement of an automated culture system is the ability to monitor live tissues. Work cells equipped with automation such as robotic arms to access incubators and imagers can be used for regular imaging to monitor cells. Quantitative readouts derived from the images that represent cell culture confluency, iPSC colony sizes, and organoid size and shape could be used as a decision metric to trigger downstream automated process such as cell passaging or to proceed to end point assay or used for quality control.
To monitor cells, brightfield imaging is a popular choice due to its simplicity and lower phototoxicity compared to fluorescent imaging. However, brightfield images tend to have low contrast, high or heterogenous background, and edge effects. These issues can hamper the ability to carry out robust image segmentation for analysis.
Machine learning or artificial intelligence (AI) refers to a set of computational algorithms that can identify patterns in existing data with or without human intervention The machine learning algorithms then automatically infer the rules to discriminate the classes.4
Deep learning is a form of machine learning that uses artificial neural networks (ANN) to learn input/output relationships. ANN are mathematical models represented by multiple layers of “neurons” or computational cells.5
The recent adoption of artificial intelligence (AI) in image analysis is rapidly gaining momentum in many research areas. Deep learning, which is one of the types of AI, has been successfully used in medical, pathological, and biological imaging applications.2 In bioimage analysis, deep learning can be used to enhance raw images for image segmentation and object tracking. Conventional image analysis typically involves defining a fixed set of parameters to segment objects of interest for downstream quantification. However, these predefined parameters do not work for all experiments due to the high variability in experimental conditions. Manual adjustments to the analysis protocol is impractical due to the sheer volume of imaging data in a high-throughput environment.
To overcome these challenges, we used AI tools for image segmentation (SINAP) and object classification (phenoglyphs) to automate the image analyses of iPSC colonies, organoids, and spheroids. The IN Carta® Image Analysis Software provides an intuitive user interface that includes AI tools in the image analysis workflow. Deep learning-based SINAP enables robust detection of complex objects of interest (e.g. stem cell colonies or organoids) with minimal human intervention. The analysis output includes morphological, intensity, and texture measurements. Classification of data can also be used with machine-learning based phenoglyphs. We demonstrate the feasibility of using AI-based object detection and phenotypic characterization for three complex cell models: expansion of iPSCs, development of 3D lung organoids, and effects of anti-cancer drugs on tumoroids. These results support the integration of deep learning image analysis methods into any high-content automation workflow that will greatly facilitate large scale generation of high-quality iPSCs and organoids for downstream applications
Materials and Methods
Image acquisition and analysis
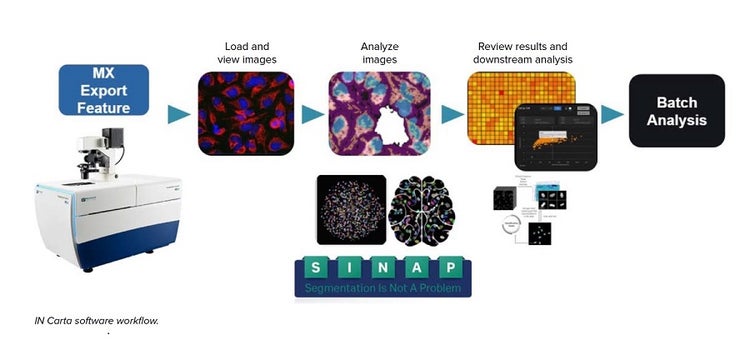
All images were acquired on the ImageXpress® Micro Confocal High-Content Imaging System (Molecular Devices) using the MetaXpress® High-Content Image Acquisition & Analysis Software. Because iPSC colonies were relatively flat and show little contrast in brightfield, images were acquired with approximately 100 µm offset to increase contrast at the edge of the colonies. For lung organoids, Z-stack images were acquired with the 4X objective with the “best focus” projection selection. For spheroids, Z-stack imaging was carried out with a 10X objective with “best focus” projection image selected.
IN Carta software was used for all analysis. The “export to IN Carta” function in MetaXpress software was used to import images into IN Carta software. SINAP was used to carry out segmentation of all images. Each model was trained and verified before being used in the analysis protocol. Post analysis, the classifier tool was used to create groups based on specific measurements. For more complex datasets, machine learning-based phenoglyphs was used to create phenotypic classes.
Cell culture
Lung organoids: 3D lung organoids were derived from primary human lung epithelial cells (ScienCell). Cells were cultured and expanded in 2D according to ScienCell protocol. For 3D organoid culture, the PneumaCult™ Airway Organoid Kit (STEMCELL Technologies) was used according to manufacturer’s protocol. Briefly, cells were seeded in 90% Matrigel (Corning) domes in 24-well plate format (1 dome per well) and were fed every second day for two weeks using the PneumaCult Airway Organoid seeding media. Differentiation was carried out for another six weeks using the PneumaCult Airway Organoid differentiation media.
iPSC culture: Human iPSC cells adapted to feeder-free conditions (SC102A-1, System Biosciences) were thawed and cultured in Complete mTeSRTM Plus culture medium (STEMCELL Technologies) in Matrigel coated plates (cat. #354277, Corning). Media was changed every day except once per week when a double volume of media was added to skip changing media on one day. Cells were passaged using the enzyme-free reagent ReLeSR™ (STEMCELL Technologies) at a 1:6–1:10 split ratio.
Spheroid culture: Spheroids were formed from TU-BcX4IC cells derived from a primary tumor. These cells are classified as metaplastic breast cancer with a TNBC subtype. TU-BcX-4IC cells were seeded at 2000 to 4000 cells per well in 384-well ULA plate (Corning) and incubated for 72 hours. Spheroids were then treated with compounds and monitored on day 1, 3, and 5.
Results
Deep learning-based model for image segmentation
Automated image analysis is an integral part of most automated imaging platform. The ability to monitor cells and organoids in real time and extract meaningful information is dependent on robust image analysis of label-free transmitted light images. Challenges associated with analysis of brightfield images include low contrast, high background, and imaging artifacts (Figure 1A). A defined set of global parameters would rarely be successful in segmenting objects imaged in brightfield. Recent advances in machine learning is improving image analysis workflow and enabling more robust image segmentation in complex datasets. Here, we show how deep learning models can be used to analyze various biological models such as in stem cell biology, 3D organoids, and spheroids.
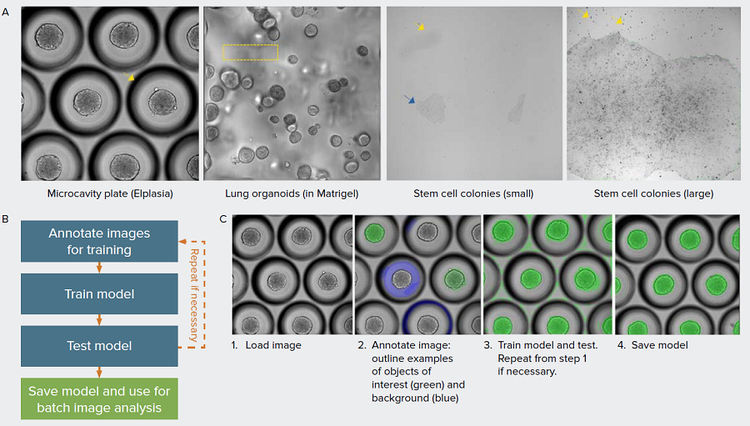
Figure 1. Overcome challenges in image segmentation with machine learning-based models. A) Examples of different biological models presented that are challenging for quantitative analysis. 3D spheroids grown in microcavity plates produce a shadow around each microcavity that interferes with object segmentation (arrow). 3D organoids are grown in Matrigel which often produces non-homogenous background due to distortion from the Matrigel dome and from objects beyond the imaging planes (box). iPSC grow as relatively flat cultures, as a result, the low contrast (blue arrow) and debris (yellow arrow) hampers robust image segmentation of iPSC colonies. B) Overview of the model training workflow. C) Main steps to create model in IN Carta software using SINAP with example images shown. Images are annotated using labeling tools to indicate the objects of interest and background. The annotated image, representing ground truth is added to the training set. In the training step, a model is created based on the most-suitable existing model and user-specified annotations. In the example shown, it is necessary to correct the segmentation mask (step 3), repeating steps 1–3.
Monitoring growth of iPSC culture over time
iPSC culture requires daily feeding and frequent visual inspection of cell morphology to check for spontaneous differentiation. Because culture passaging is determined by colony size and distribution, it is important to monitor the growth of iPSC cultures. Here, the size of individual iPSC colonies are monitored over six days in culture using brightfield imaging and machine learning-based image segmentation for analysis (Figure 2).
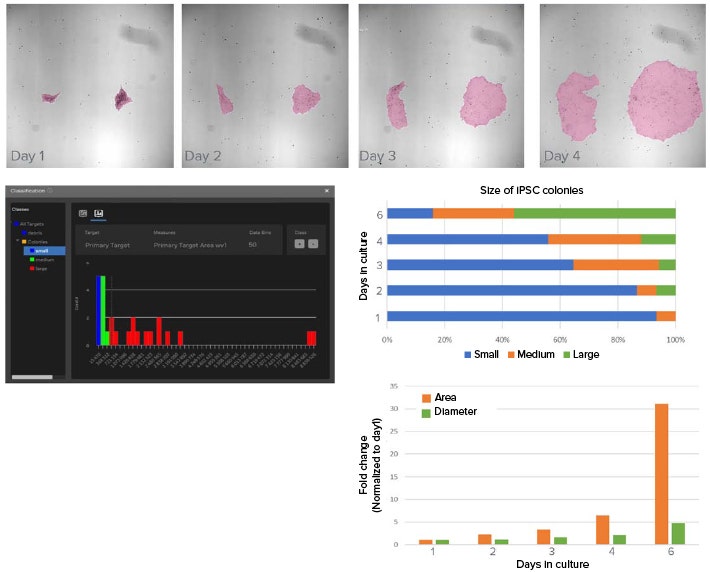
Figure 2. Deep learning-based model used to segment iPSC colonies and monitor growth. A) Example images showing the growth of iPSC in culture over four days. Shown in pink overlay is the segmentation mask from using SINAP. Approximately 12 images were annotated and used to train the deep learning model in SINAP. B) Classifier tool in IN Carta software is used to categorize segmented objects based on user selected measurements and gates. Here, objects are categorized in small, medium, and large classes according to their area. C) Graph shows distribution of iPSC colony sizes over time. As expected, the frequency of large iPSC colonies increased over time in culture. D) Change in average iPSC colony area and diameter over time in culture (normalized values).
Analysis of 3D lung organoids
3D organoids are powerful models with many biomedical applications. Because they can be derived from any patient, organoids hold huge potential in drug discovery and in personalized therapeutics. Organoids may be cultured up to months thus the ability to monitor organoid status is instrumental for quality control and time-lapse studies.
Here, we show an example of lung organoids cultured and imaged in Matrigel domes over time in brightfield (Figure 3). Measurements such as area, diameter, shape factor, texture, and intensity may be used to monitor organoid growth and differentiation.
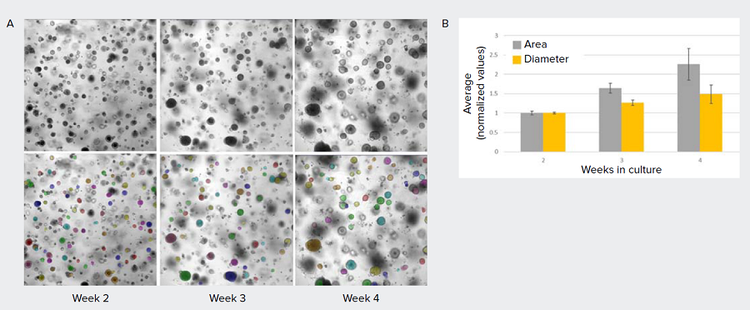
Figure 3. Applying AI-based method to assess growth of lung organoids. A) Images of lung organoids grown in Matrigel dome. These images usually have high, non-homogenous background which prevents robust object segmentation using conventional image analysis methods. Using SINAP, a model was created to segment lung organoids (mask shown in colored overlay). B) Graph showing change in average lung diameter and area over 2, 3, and 4 weeks in culture (normalized, error bars represent standard deviation between replicate wells).
Segmentation and classification of compound treatment of patient-derived tumor spheroids
Patient-derived tumor spheroids can potentially be used in precision medicine and drug discovery to identify therapeutic compounds. Cells derived from a primary tumor harboring the triple negative breast cancer subtype were cultured and treated with anti-cancer compounds.3 Effects of treatment of the spheroids were monitored over time (Figure 4). In addition, based on the brightfield images, multiple spheroid phenotypes could be observed. While the untreated spheroids show a tightly packed structure with defined edges, treated spheroids show varying degrees of undefined, ‘diffused’ edges. IN Carta® Phenoglyphs Software Module is a tool for machine learning-based classification and can be used to identify phenotypical clusters based on spheroid morphology, intensity, and texture. We propose that this approach may be used to quickly identify compound effects in future screens.
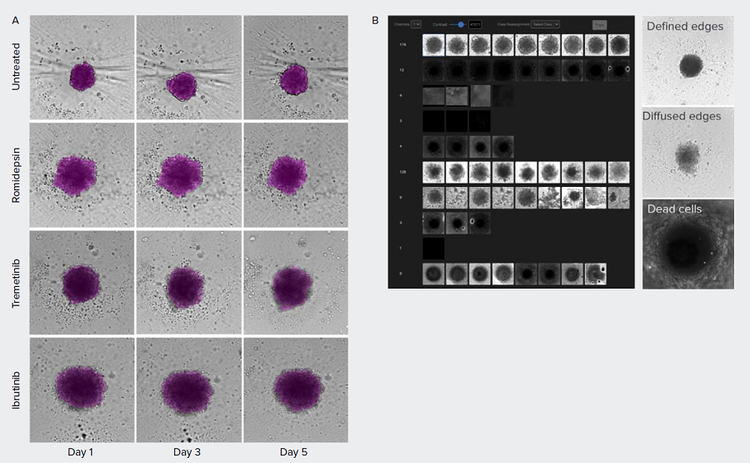
Figure 4. Morphometric analysis of compound treatment on patient-derived spheroids over time. A) Spheroids were monitored using brightfield imaging on days 1, 3, and 5 post-treatment. Images were segmented using SINAP in IN Carta software (magenta overlay). B) IN Carta Phenoglyphs Software Module was used to detect the different phenotypes. Untreated control spheroids show tightly packed cells with defined edges while treated spheroids show a variety of phenotypes. The edges of the treated spheroids are less defined, have a diffused edge, and cells are loosely packed.
Conclusions
- AI-enabled approach in analysis of complex images and datasets offer robust results for high-content imaging workflows.
- SINAP is a user-friendly tool to create custom deep learning models for robust segmentation of label-free biological models.
- Phenoglyphs enables intuitive machine learning-based phenotypic profiling that can be applied to complex datasets such as patient-derived spheroids.
- SINAP and phenoglyphs are complementary AI tools in IN Carta software that offer an end-to-end solution, bridging the gap between complex biological questions and AI-driven answers.
References
- Clevers H. Modeling development and disease with organoids. Cell. 2016;165(7):1586–97.
- Meijering E. A bird’s-eye view of deep learning in bioimage analysis. Comput Struct Biotechnol J. 2020;18:2312-2325. Published 2020 Aug 7. doi:10.1016/j.csbj.2020.08.003
- Chang TC, Matossian MD, Elliott S, et al. Evaluation of deacetylase inhibition in metaplastic breast carcinoma using multiple derivations of preclinical models of a new patientderived tumor. PLoS One. 2020;15(10):e0226464. Published 2020 Oct 9. doi:10.1371/journal.pone.0226464
- Kan A. Machine learning applications in cell image analysis. Immunology and Cell Biology. 2017; 95: 525-530.
- Midtvedt B, Helgadottir S, Argun A, et al. Quantitative digital microscopy with deep learning. Applied Physics Reviews. 19 February 2021, DOI: 10.1063/5.0034891