
Application Note
Label-free cell segmentation with IN Carta SINAP application module
- Use SINAP deep-learning application module for robust segmentation of label-free cells
- Utilize an easy workflow to customize SINAP pre-trained deep-learning models for your images
- Get reliable quantitative data with SINAP label-free cells segmentation
Alla Zaltsman, PhD | Software Validation Scientist | Molecular Devices
Misha Bashkurov, PhD | Product Owner | Molecular Devices
Yu-Chen Hwang, PhD | Imaging Software Product Manager | Molecular Devices
Introduction
Label-free cell analysis provides a better alternative to using fluorescent dyes as it enables scientists to image live cells under near-native conditions – examining biological processes without the adverse effect of using genetic modification or reagents to label and fix the cells. Using transmitted light (TL) images to detect cells is also effective to maximize the use of fluorescent channels for specific labels.
Object segmentation to accurately distinguish targets of interest from the background, debris, and each other is a necessary step of image analysis workflow. However, a robust cell segmentation method for label-free microscopy can be very difficult due to the transparent nature of cells, the variability in acquisition conditions, low contrast, and shading problems.
In this application note we use SINAP, an artificial intelligence (AI)-based segmentation tool in IN Carta® Image Analysis Software to tackle these challenging TL segmentation issues.
SINAP segmentation workflow
SINAP utilizes a deep-learning algorithm to detect objects of interest in images. This is done through model training using “ground truth” images, where objects of interest and background are manually annotated.
The SINAP module in IN Carta includes base models for specific biological structures, which were trained on a large set of annotated images. The base models can be used directly for segmentation of the objects they were trained to detect (Figure 1, A). Alternatively, they can serve as a starting point from which users can further “teach” the algorithm to recognize biological structures of interest in their samples and exclude unwanted objects (Figure 1, B). Such further algorithm learning to improve the model’s performance is done within a user-friendly SINAP workflow using user-annotated images. The process of training can be iterative, and more images can be annotated to improve the model (Figure 1, C).
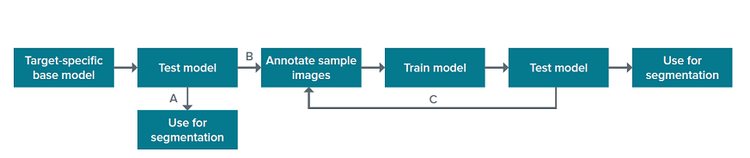
Figure 1. SINAP segmentation workflow.
The list of base models provided in IN Carta includes a model for segmentation of cells in the transmitted light images (TL_Cells model).
Transmitted Light Cells base model can be used for label-free cell segmentation
TL_Cells model can be used for segmentation (Figure 1, A) when image characteristics (such as image contrast and shading) and cell morphology are similar to images used for training (Figure 2).
Although the image in Figure 2 has an uneven background with debris, the model successfully locates the cells and separates them from the background.
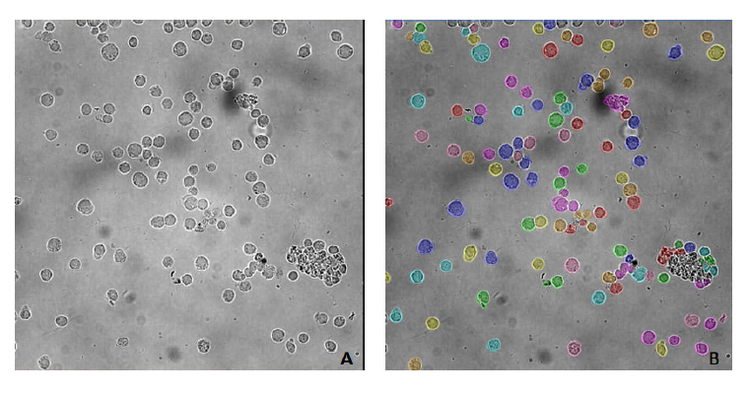
Figure 2. PBMC (peripheral blood mononuclear cells) segmented with TL_Cells base model. A) original image; B) cell masks after segmentation with TL_ Cells base model. The image was acquired using IN Cell Analyzer 2200 (GE Healthcare), 40x objective. Image analysis was performed in IN Carta v1.15.
Transmitted Light Cells base model can be further trained to accurately segment cells within images
You can further train the base model by adding annotated images from the tested samples to better recognize cells and improve the segmentation outcome.
The SINAP module includes easy-to-use tools that allow users to quickly annotate the images (or regions of interest), then add them to the training set. By expanding the training set with images containing corrected features where the current model is failing, the model can be either fine-tuned for minor improvement or retrained for deeper learning process.
The extent of the required image correction varies from sample to sample as demonstrated in Figure 3.
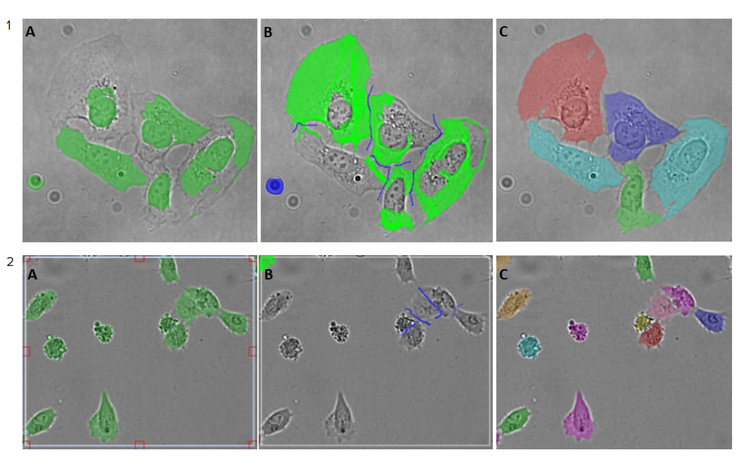
Figure 3. Example of the image annotation process. 1) Hela cells image (acquired using ImageXpress® Micro Confocal High-Content Imaging System, with 20x objective), only a minor correction was required in this example. 2) U2OS cells image (acquired using IN Cell Analyzer 6000 (GE Healthcare), with 20x objective), a significant correction was required. A–C panels represent the steps in the annotation process: A) Region of interest was selected in the segmented image, which included correctly and incorrectly segmented cells; B) SINAP tools were used to correct errors, by amending cell outlines (Bright Green) and adjusting background, including corrections in splitting the touching cells (Blue) as shown. The updated region of interest (B) was added to the training set; C) Once the training set was collected, a model was trained. The newly trained model was applied to segment the images. Segmentation was more accurate by the multi-colored cell segmentation mask.
The example presented in Figure 4 demonstrates the SINAP segmentation workflow. In Figure 4, panel A, the TL-Cells base model was used to segment CHO cells images according to the SINAP segmentation workflow illustrated in Figure 1, A. However, some cells were not detected due to uneven illumination across the image. The model was then fine-tuned using manually annotated regions of interest (ROI). The annotated ROIs included both correctly and poorly segmented cells. The model’s ability to pick up individual cells, regardless of their locations in the image, was improved as the number of annotated ROIs for training the model increased from 5 to 10 (Figure 4, panels B and C; SINAP segmentation workflow, Figure 1, B and C).
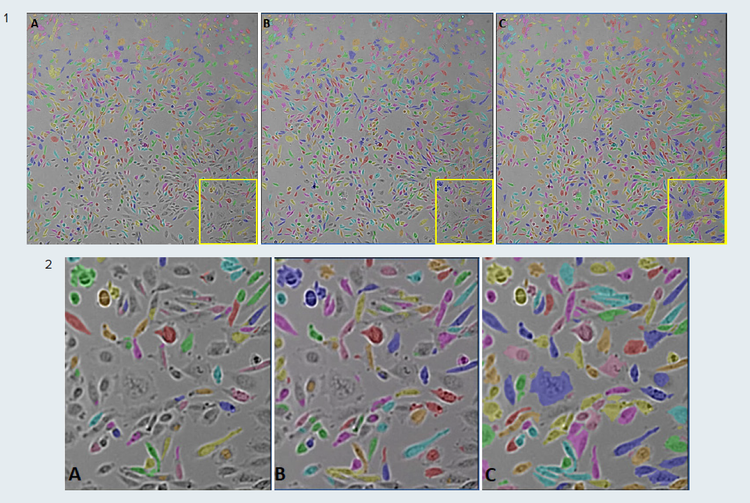
Figure 4. Example of SINAP model fine-tuning. CHO cells segmented in IN Carta with TL_Cells base model before and after fine-tuning. 1) Whole images (field of view); 2) Outlined (yellow) regions of the images. A) segmentation with the base TL_Cells model. Segmentation mask (multi-colored) shows that only some of the cells were detected; B) segmentation with TL_Cells model, fine-tuned using five annotated ROIs; There was an improvement in the cells detection, but some cells were still not identified; C) segmentation with TL_Cells model, fine-tuned using 10 annotated ROIs. A significant improvement in the model’s accuracy to detect cells was achieved. Images were acquired on an ImageXpress® Micro Confocal High-Content Imaging System, with 10x objective.
The count of label-free cells, segmented with SINAP, is highly correlated with the count of nuclei segmented in fluorescent images
We used samples of serial dilutions of CHO and HEK 293 cells to assess the accuracy of cell segmentation with SINAP. Nuclei were counterstained with Hoechst. Both transmitted light and DAPI-channel fluorescent images were acquired. Cells in the transmitted light images were segmented using a fine-tuned TL_Cells base model and DAPI-stained nuclei were segmented using a Nuclei Robust segmentation method.
Results demonstrate (Figure 5) that the number of cells and nuclei correlate well across the range of cell densities, with paired t-test analysis showing no significant difference between them.
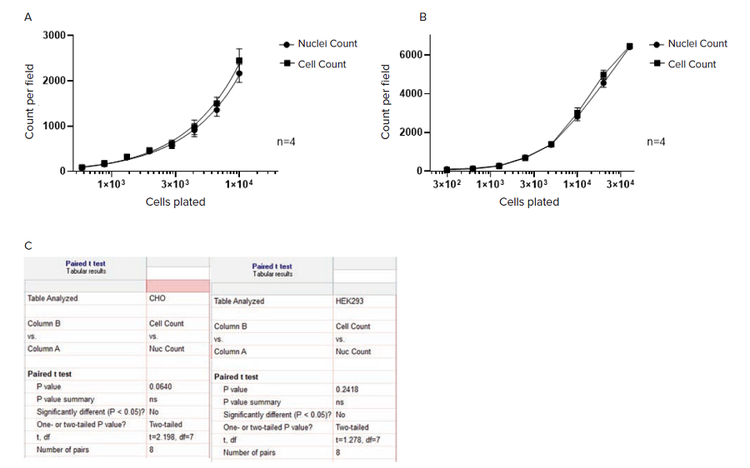
Figure 5. Counting label-free cells, segmented with SINAP, and nuclei segmented in fluorescent channel with Nuclei Robust segmentation. Image segmentation and analysis was performed using IN Carta Image Analysis Software v1.15. A) CHO cells; Images were acquired on an ImageXpress Micro Confocal High-Content Imaging System, with 10x objective. B) HEK 293 cells; Images were acquired on SpectraMax® MiniMax™ 300 Imaging Cytometer, with 4x objective. All data shown is the mean of four wells (±SD). C) Paired t-test analysis was performed in GraphPad Prizm software.
Conclusions
- IN Carta SINAP deep-learning module can be used effectively for segmentation of label-free cells.
- Pre-trained base models for cell segmentation in transmitted light can be customized easily by fine-tuning or retraining with additional annotated images.
- Label-free cell segmentation accuracy is comparable to the segmentation of nuclei in a fluorescent channel when using SINAP as demonstrated by the cell/nuclei counts correlation.