
Application Note
Measure cell migration using discontinuous time-lapse imaging of live cells
- Perform reproducible, automated cell migration experiments
- Save time and storage space by acquiring only key timepoints
- Visualize time-lapse responses of the entire plate at once
- Ensure reliable statistical results using high-content analysis
Introduction
Jayne Hesley | Imaging Applications Scientist | Molecular Devices
Cell migration is an essential process required for many biological events including embryonic development, wound healing, cancer metastasis, and immunological responses. In most cases, immune cells migrate to the site of inflammation during the activation of the innate immune system in response to cytokine signals and chemokine gradients to clear damaged tissue and regenerate tissue1, 2. However, the migration and accumulation of immune cells can also result in the development of many autoimmune diseases like rheumatoid arthritis3. Additionally, increased cell motility in the tumor microenvironment of cancer patients can exacerbate cancer progression4. Thus, it is critical to measure cell motility when studying the pathogenesis of certain diseases in order to develop new potential therapies and drugs.
Cell motility is often measured in a controlled environment using cell migration assays that utilize a manually created “scratch” for observing cell movement into a wounded area. However, manually preparing scratches is laborious and time-consuming, making the technique less ideal for high-throughput screening studies.
Here, we demonstrate a scaled-up method that illustrates how cell migration imaging and real-time analysis can be performed in a 96- or 384-well microplate to enable high throughput cell motility experiments (Figure 1). This adapted cell migration assay, developed by Platypus Technologies, makes it possible to screen several compounds that can affect the cell’s ability to migrate in one controlled experiment with adequate replicates. Cells are first plated in a microplate containing a dissolvable, biocompatible gel that creates a cellfree, exclusion zone. A few hours after plating, imaging commences using ImageXpress™ Pico Automated Cell Imaging System to measure cells’ migration into the cell-free zone. The discontinuous time-lapse feature available in the CellReporterXpress™ Image Acquisition and Analysis Software allows wells acquired at different timepoints to be stored in one file and analyzed and plotted seamlessly as a time-lapse experiment. Using this approach, we successfully show differences in wound healing in HT 1080 (fibrosarcoma) cells after treatment with the chemotherapeutic compounds Cytochalasin D, Colchicine, and Nocodazole.
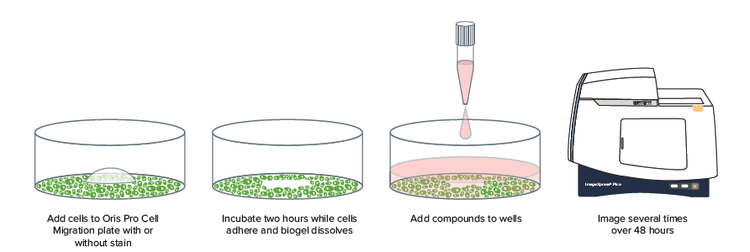
Figure 1. Cell migration experiment using the ImageXpress Pico system. The plate was imaged at different timepoints between 2 and 45 hours to measure the effects of the compounds on cell migration.
Materials
- HT 1080 fibrosarcoma cell line (ATCC, P/N CCL-121)
- SiR-Actin Kit (Cytoskeleton Inc., P/N CY-SC001)
- Cytosine ß-D-arabinofuranoside hydrochloride (Ara C) (Sigma Aldrich, P/N C1768)
- Oris ™ Pro Cell Migration Assay (Platypus Technologies, P/N PRO384CMA1)
- ImageXpress Pico Automated Cell Imaging System (Molecular Devices)
- CellReporterXpress Image Acquisition and Analysis Software (Molecular Devices)
Methods
HT 1080 cells were first treated with Cytosine ß-D-arabinofuranoside hydrochloride (Ara C) and SiR-Actin to a final concentration of 20 μM and 0.1 μM, respectively. Ara C inhibits cell division to ensure that the presence of cells in the exclusion zone can be attributed only to cell migration and not cell division while SiR-Actin is an innocuous fluorescent dye that stains the actin of live cells. After treatment, cells were plated in a 384-well Oris Pro Cell Migration plate at a concentration of 10,000 cells/well with a final volume of 30 μL and returned to the incubator.
After cells had attached and the gel had dissolved for two hours, 30 μL of chemotherapeutic compound was added to the 30 μL of cells already in the well. Cells were imaged using a discontinuous time-lapse series using the ImageXpress Pico system so that plates of live cells could be imaged at eight timepoints over the course of a 45-hour period without preventing other scientists in the lab from running their experiments in a multi-user environment.
This feature appends images into one experiment for seamless time-lapse analysis and eliminates the generation of too much extraneous data since it may take days for cells to fully migrate into the exclusion zone (Figure 2). At a magnification of 4X, a single image of the entire well was acquired using both transmitted light (< 5 ms exposure) and Cy5 fluorescence (500-1000 ms exposure). The numerical results were generated simultaneously with acquisition using analyses protocols optimized for both transmitted light (Transmitted Light, Large Cell) and fluorescent analysis (Cell Scoring – Cy5 nuclei and cytoplasm) (Figure 3).
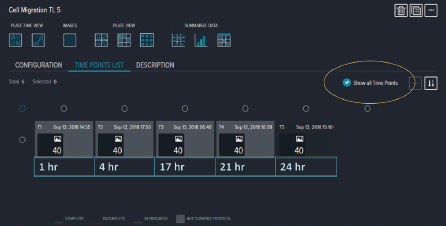
Figure 2. Discontinuous time-lapse experiment with varied intervals between each acquisition timepoint.
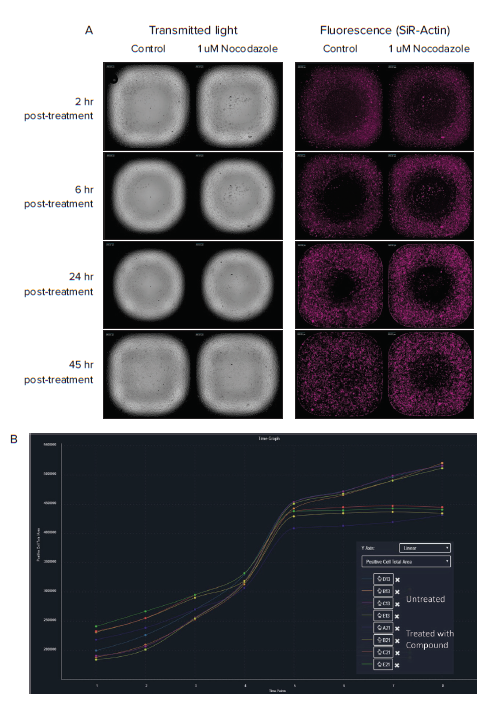
Figure 3. A. Example of transmitted light and fluorescent (SiR-Actin) images of HT 1080 control cells (left) compared to cells treated with 1 μM Nocodazole (right) at four representative timepoints. Nocodazole slowed migration into the exclusion zone. B. CellReporterXpress software visualization of the cells migrating into the exclusion zone. Untreated control cells migrated faster compared to Compound treated cells.
As expected, treating the cells using Colchicine, Cytochalasin D, and Nocodazole significantly decreased cell migration when compared to control cells (Figure 4), with Cytochalasin D inhibiting cell migration the most. The decrease in cell migration was also observed using fluorescent images obtained from cells stained with SiR-Actin (Figure 5). This indicates that cell migration assays may be run with or without fluorescent SiR-Actin labeling in cell lines that retain the dye.
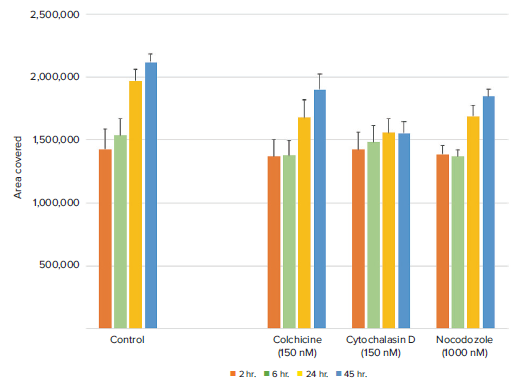
Figure 4. Transmitted light analysis over time demonstrates that compound-treated wells exhibited decreased cell migration. Cytochalasin D had the longest-lasting effect on inhibition of migration.
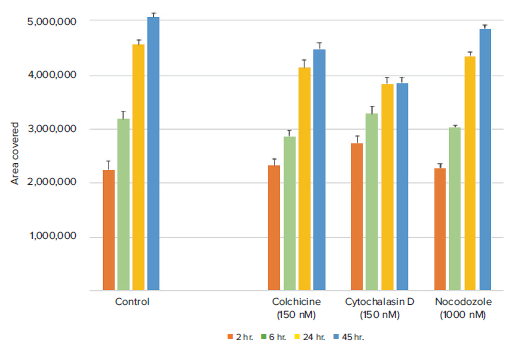
Figure 5. Analysis of fluorescently labeled cells over time demonstrates that compound-treated wells exhibited decreased cell migration. Data correlates with results obtained using transmitted light.
Conclusion
The ImageXpress Pico system and CellReporterXpress software were used to image and analyze cell migration over the course of 45 hours in HT 1080 cells plated in a 384-well Oris Pro microplate. As expected, treatment with the chemotherapeutic compounds Colchicine, Cytochalasin D, and Nocodazole significantly decreased the rate of cell migration compared to control. Data obtained using transmitted light and fluorescence correlated, indicating cell migration can be observed in cells labeled with or without a fluorescent stain like SiR-Actin, as long as the cells can retain the dye during the course of the experiment.
The ImageXpress Pico system allows researchers to quantitate, over time, cell migration into a cell-free area. Time-lapse images may be acquired automatically at defined intervals or manually by moving the plate in and out of the instrument if, for example, the instrument is not equipped with the environmental control option needed to maintain the live cells or if other lab users need to acquire images on the same instrument during a long time-lapse experiment. The instrument can accommodate these assays in 96- or 384-well Oris Pro microplates using low magnification objectives (4X or 10X) and the software automatically stitches sites together if more than one field of view is necessary. It is simple to set up an analysis protocol in the integrated CellReporterXpress software to use transmitted light or fluorescence images to report the area of the well covered by the cell monolayer and the results are available while the plate images are still being acquired.
References
- Barrett CS, Millena AC, Khan SA. (2017) TGF-ß Effects on Prostate Cancer Cell Migration and Invasion Require FosB. Prostate 77(1):72-81
- Julier Z, Park AJ, Briguez PS, Martino MM. (2017) Promoting tissue regeneration by modulating the immune system. Acta Biomater 53:13-28
- Nevius E, Gomes AC, Pereira JP. (2016) Inflammatory Cell Migration in Rheumatoid Arthritis: A Comprehensive Review. Clin Rev Allergy Immunol 51(1):59-78
- Shiraishi M, Shintani Y, Ishida H, Saba R, Yamaguchi A, Adachi H, Yashiro L, Suzuki K. (2016) Alternatively activated macrophages determine repair of the infarcted adult murine heart. J Clin Invest 126(6):2151-66