
Application Note
Monitor multiple stages of apoptosis with live cell kinetic imaging
- Perform live cell time-lapse imaging with complete environmental control
- Monitor phenotypic changes in real time
- Analyze multiple phenotypes with a single analysis module
- Generate kinetic data reports automatically
Matthew Hammer | Applications Scientist | Molecular Devices
Introduction
The study of apoptosis is a critical aspect of drug discovery and development. Additionally, studying the relationship between apoptosis and other factors, such as oxidative stress, is crucial for understanding specific diseases that are associated with the dysregulation of apoptosis. Premature cell death and apoptosis have been associated with Alzheimer’s, Parkinson’s, and a variety of autoimmune diseases.1,2,3 Conversely, diseases such as cancer are defined by uncontrolled proliferation, which can be caused by mutations that lead to the disruption of apoptosis pathways.
Cell-based assays are an efficient model for uncovering the cytotoxic effects of drugs and for studying their mechanism of action. Furthermore, identifying the mechanisms behind drug induced cell death and monitoring apoptosis allows for the modification of drugs and prevention of unintentional toxicity. Time-lapse live cell assays provide distinct advantages as compared to end-point assays in this regard. They enable the real-time monitoring of phenotypic changes in response to compound treatment, as well as the assessment of transient events. They also aid in assay optimization by uncovering the appropriate time to read end-point assays and the desirable concentration ranges for compound testing.
We ran two apoptosis assays to study the cytotoxic effects of anti-cancer compounds on HeLa cells. Long-term time-lapse imaging was performed on the ImageXpress® Pico Automated Cell. Imaging System. Live cell conditions were maintained with the fully integrated environmental control component within the ImageXpress Pico system, which allows for the control of CO2, O2, temperature, and humidity all from within the CellReporterXpress™ Image Acquisition and Analysis Software.
Materials
- HeLa cells
- HeLa media (MEM, 10% FBS, 1% Pen/Strep)
- Live Cell Imaging Media (Fluorobrite DMEM, 5% FBS, 1% L-Glutamine, 1% Pen/Strep)
- 96-well microplates (Greiner, cat. #655090)
- 384-well microplates (Corning Falcon, cat. #353962)
- Staurosporine (Millipore Sigma, cat. #S4400)
- Paclitaxel (Millipore Sigma, cat. #T7402)
- EarlyTox Nucview488 Caspase 3/7 Assay Kit (Molecular Devices, cat. #R8350)
- Ethidium Homodimer III (Molecular Devices, EarlyTox Live/Dead Assay Kit cat. #R8340)
- Hoechst 33342 (Invitrogen)
- CellROX ™ Deep Red Reagent (ThermoFisher Scientific, cat. #C10422)
- ImageXpress Pico Automated Cell Imaging System and CellReporterXpress Image Acquisition and Analysis Software (Molecular Devices)
Methods
Cell health apoptosis assay
HeLa cells were plated at a density of 5,000 cells/well in a 384-well microplate and incubated overnight at 37°C and 5% CO2. The cells were then stained for 45 minutes with Hoechst 33342 (3 μM) in HeLa media. After incubation, the Hoechst solution was removed prior to the addition of a 2x solution of NucView 488 Caspase 3/7 (5 μM final), Ethidium Homodimer III (EthD-III, 1 μM final), and compounds. This second staining solution and compound dilutions were made in phenol red free live cell imaging media. Compound treatment was run in triplicate with a 1:2 dilution starting at 10 μM and 100 μM for staurosporine and etoposide, respectively.
Oxidative stress and apoptosis assay
HeLa cells were plated into a 96-well microplate at 8,000 cells/well and incubated overnight at 37°C and 5% CO2. Media was then removed from each well, and a 3 μM Hoechst 33342 and 5 μM CellROX Deep Red staining solution was added to each well. After 40 minutes of incubation, the staining solution was removed, and the cells were washed twice with warm DPBS. A 2X NucView 488 Caspase 3/7 solution (5 μM final) was added to the wells along with a 1:2 dilution of staurosporine, starting at 10 μM. The NucView 488 solution as well as the compound dilutions were made in live cell imaging media. The compound treatment was run in quadruplicate.
Long-term live cell imaging
Long-term live cell imaging was performed on the ImageXpress Pico Environmental Control System. The plates were placed into the Environment Control Cassette, which fit on the stage inside the instrument and allowed for the complete maintenance of the desired environmental control settings (5% CO2, 85% humidity, 20% O2, 37°C) protected from ambient light. A 14-hour time-lapse acquisition, capturing images every two hours, was performed for the cell health apoptosis assay. Images were captured every hour for six hours for the oxidative stress apoptosis assay. The acquisition settings for both assays are listed in Table 1. The EC sensor readings were recorded during the acquisition, which allowed for the monitoring and QC of the Environmental Control settings throughout the entirety of the acquisitions.
DAPI (10)
FITC (200)
Texas Red (100)
DAPI (10)
FITC (200)
Cy5 (500)
Table 1. Acquisition settings for the cell health apoptosis and oxidative stress apoptosis assays. A single site at 10X covered 17.63% of a 384-well microplate well and four sites at 20X covered 5.1% of a 96-well microplate well. The four sites 20X acquisition was run with an image stitching acquisition protocol for seamless, on-the-fly stitching.
Image analysis
Multiwavelength analysis enables the measurement of cell health as cells progress through stages of cell death
As seen in Figure 1, the three channel cell scoring analysis module in CellReporterXpress was used to measure the distribution of the three fluorescent dyes and quantitate distinct changes in cell phenotypes post-compound treatment. Nuclear condensation and caspase activation are critical steps during the onset of apoptosis. Nuclear condensation was seen with the increased intensity of the Hoechst nuclear dye and the decreased area of the nucleus (Figure 2A). Cells that were only positive for the caspase 3/7 stain were scored as early apoptotic (Figure 1). The maximum number cells in early apoptosis were identified at six hours for the highest staurosporine concentrations tested and at 14 hours for the highest concentrations of etoposide (Figure 2B). Late apoptosis was determined by increased membrane permeability and measurement of cells positive for both caspase and ethidium homodimer III staining. Necrotic cells were identified as cells positive for only the ethidium homodimer III. Curve-fitting was performed at the 14-hour time point to generate dose-response curves and EC50 values for the tested compounds (Figure 3). The results demonstrated a dose-dependent decrease in cell viability with a dramatic decrease at concentrations between 0.039 μM and 10 μM for staurosporine and between 7.5 μM and 100 μM for etoposide. At this time point, there was a decrease in the percent of cells in early apoptosis at the highest concentrations of staurosporine while there was an increase in necrotic and late apoptotic cells. For etoposide, cells at concentrations from 7.5 – 100 μM were mainly in early apoptosis, indicating that it may be necessary to extend the timecourse or to increase the compound concentration to elicit a significant population of cells in late apoptosis or necrosis.
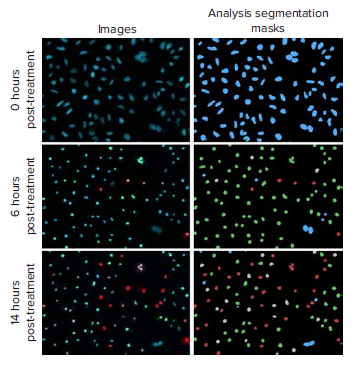
Figure 1. Representative images and analysis segmentation masks of staurosporine (10 μM) treated HeLa cells at 0, 6, and 14 hours post-treatment. Distinct changes in apoptosis phenotypes were analyzed with the three channel cell scoring analysis module in CellReporterXpress software: viable cells (blue mask), caspase positive cells (green mask), caspase and EthD-III positive cells (grey mask), EthD-III only positive cells (red).
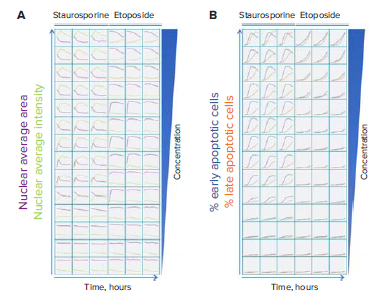
Figure 2. Stages of apoptosis were monitored in real time over 14 hours after treatment with various concentrations of staurosporine and etoposide. Images were captured every two hours. A. Nuclear condensation was measured using Hoechst 33342 nuclear stain. B. Cells stained with Hoechst 33342 were scored for Caspase 3/7 and Ethidium Homodimer III staining to indicate stage of cell death.
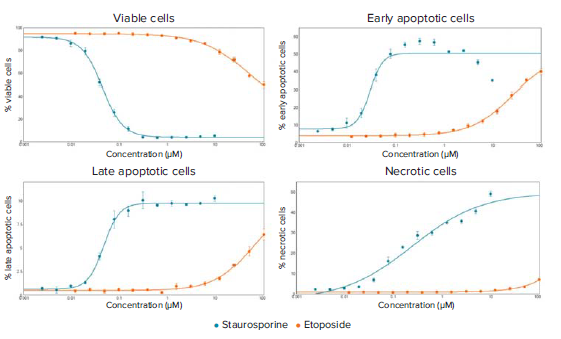
Figure 3. Dose-response curves for staurosporine and etoposide treated cells at the 14-hour time point. EC50 values were generated for the four curves: % Viable cells (staurosporine: 0.044 μM, etoposide: 48.61 μM), % Early apoptotic cells (staurosporine: 0.029 μM, etoposide: 25.84 μM), % Late apoptotic cells (staurosporine: 0.047 μM, etoposide: 61.81 μM), % Necrotic cells (staurosporine: 0.238, etoposide EC50 not reached).
Multiwavelength analysis enables measurement of oxidative stress and apoptosis simultaneously
Recording responses using time-lapse acquisitions is beneficial for determining optimal experimental endpoints and ideal concentrations of compounds that induce desirable effects. They also aid in measuring numerous biological activities in the same well, some of which are transient events. As represented in Figure 4, the multiwavelength cell scoring analysis was utilized to identify three distinct populations of cells. Maximum responses of oxidative stress and apoptosis were dependent upon staurosporine dosage. For the highest three concentrations, ROS levels peaked early and then plateaued as caspase 3/7 activation increased between three and four hours. For the lower concentrations of staurosporine, a gradual increase in ROS positive cells and CellROX intensity was noted without a significant induction of apoptosis (Figure 5 and 6). To run this assay at a single endpoint, the scientist might choose to image at six hours post-staurosporine treatment.
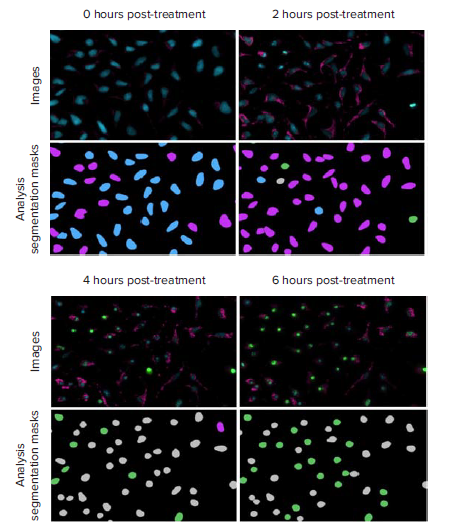
Figure 4. Representative 20X images and analysis segmentation masks of HeLa cells progressing through oxidative stress accumulation and caspase activation. These images were from cells treated with 5 μM staurosporine. Images: nuclei (Hoechst 33342, blue), caspase 3/7 (NucView 488, green), ROS (CellRox Deep Red, pink). The three channel cell scoring analysis was run to measure the number and percent of healthy cells (blue) and cells positive for only oxidative stress (pink), only caspase 3/7 (green), or positive for both oxidative stress and caspase 3/7 (gray) at each time point.
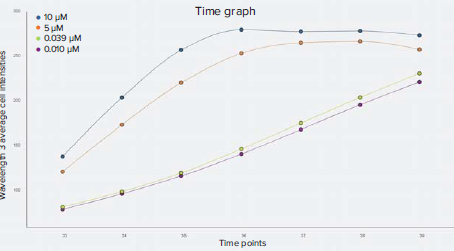
Figure 5. Kinetic time graph of wavelength 3 (CellROX Deep Red) average integrated cell intensities. For the highest concentrations of staurosporine, represented by the 10 μM and 5 μM data points, CellROX Deep Red stain intensity peaked at around three and four hours and then plateaued. CellROX Deep Red staining gradually increased throughout the time series for the low concentrations of staurosporine.
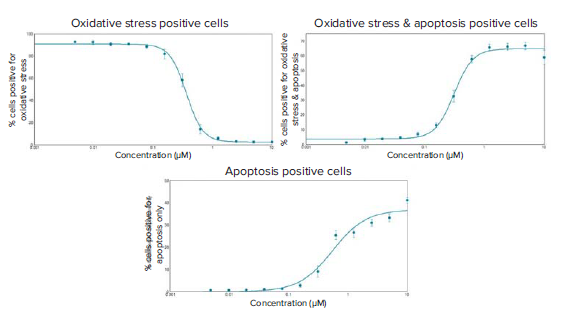
Figure 6. Dose-response curves of staurosporine induced oxidative stress and apoptosis in HeLa cells at six hours post-compound treatment. EC50 values were generated for the three curves of the different phenotypic readouts: % cells positive for oxidative stress only: 0.361 μM, % cells positive for oxidative stress and apoptosis: 0.314 μM, and % cells positive for apoptosis only: 0.547 μM.
Conclusion
These assays demonstrate the benefit of running time-lapse acquisitions in complete live-cell environmental conditions for the real-time monitoring of multiple cell-health markers at once. The ImageXpress Pico Automated Cell Imaging System equipped with Environmental Control enables a temporal view of HeLa cells progressing through multiple stages of cell death. In addition, these experiments show the utility of the three channel cell scoring analysis module to measure cells in various stages of the apoptosis pathway and provide valuable insight into the cytotoxic effects of anti-cancer compounds.
References
- J.M. Brown, L.D. Attardi (2005). The role of apoptosis in cancer development and treatment response. Nat Rev Cancer 5(3):231-7.
- D.W. Dickson (2004). Apoptotic mechanisms in Alzheimer neurofibrillary degeneration: cause or effect? J Clin Invest 114(1):121-30.
- W.G. Tatton, R. Chalmers-Redman, D. Brown, N. Tatton (2003). Apoptosis in Parkinson’s disease: signals for neuronal degradation. Ann Neurol 53(suppl 3): S61-70.