
Application Note
Protein A contaminant assay
Introduction
Protein A, purified from the cell wall of S. aureus, is a 42,000 Dalton protein. It has four binding sites for the Fc region of antibodies of which only two sites may be occupied simultaneously. This ability to bind to the Fc region is utilized for the purification of antibodies1 . Chromatography media or membrane containing covalently bound Protein A captures antibodies from solution while other components pass through the column or membrane. The bound antibodies are then eluted by decreasing the pH. Antibodies purified in this manner, and intended for pharmaceutical use, must be tested for Protein A that may have leached from these media.
This application note provides preliminary performance of a Protein A contaminant assay using a commercially available anti-Protein A antibody. Chicken antibody was chosen because Protein A does not bind to its Fc region1. This note is intended as a guide and does not represent a validation of this assay, nor necessarily the optimal performance parameters.
Materials
The recombinant form of Protein A was used as the standard for the following data. All samples, standards, and labeled antibodies were diluted in ILA Assay Buffer
- Threshold® System**** from Molecular Devices Corporation (catalog #0200-0500), 1311 Orleans Drive, Sunnyvale, CA 94089, tel: 408-747-1700 or 800-635-5577.
- Immuno-Ligand Assay Labeling Kit**** from Molecular Devices Corporation (catalog #R9002).
- Immuno-Ligand Assay Detection Kit**** from Molecular Devices Corporation (catalog #R9003).
- Recombinant Protein A**** from CalBiochem (catalog #539203), San Diego, CA, tel: 800-854-3417 or 619-450-9600.
- Polyclonal chicken anti-Protein A antibody**** (raised against purified Protein A and immunoaffinity purified) was purchased from OEM Concepts, Toms River, New Jersey, tel: 908-341-3570.
- Sephadex® G-25 columns**** were purchased from Pharmacia Biotech (PD-10, catalog #17-0851-01).
- Sample antibodies**** (HuIgG, MuIgG 1, MuIgG 2a , and MuIgG 2b ) were kindly provided by customers of Molecular Devices Corporation.
Methods
Labeling of antibodies
The chicken anti-Protein A antibody was labeled as described in the ILA section of the Threshold System Operator's Manual and the ILA application note Optimizing the labeling of proteins. The chicken anti-Protein A antibody was dialyzed overnight at 4°C against PBS to remove sodium azide prior to labeling. Aliquots of the antibody were incubated with either biotin-DNP-NHS or fluorescein-NHS at a 20:1 molar coupling ratio (MCR) for 2 hours at room temperature, in the dark. The MCR is defined as the moles of biotin label or fluorescein label (hapten) per mole of protein used in the labeling reaction.
The unreacted label was separated from the antibody by passing the reaction solution over a Pharmacia PD-10 column which had been equilibrated with 25 mL PBS. The protein concentration and molar incorporation ratio (MIR) were calculated as described in the ILA section of the Threshold System Operator's Manual. The MIR is defined as the average number of moles of label covalently bound per mole of protein. The labeled antibodies were diluted to 10 µg/mL in ILA Assay Buffer and 250 µL aliquots were stored at -20°C. Antibody labeled at 1.0 mg/mL had MIR's of 4.1 for biotinylated chicken anti-Protein A and 4.6 for fluoresceinated chicken anti-Protein A. Some variation in background rates (µV/ sec) was observed for different labelings with the chicken anti-Protein A antibody; however, sensitivity and dynamic range remained consistent.
Determining the optimal concentrations of antibodies per test (loading study)
Four concentrations of each labeled antibody (12.5, 25, 50, 100 ng/test) were tested with 3 analyte concentrations (0, 50 pg/mL, and 500 pg/mL) to evaluate background rates and slope (see following pages for the general assay protocol). Equal amounts of biotinylated and fluoresceinated antibody were used because the same polyclonal antibody was labeled; thus, both labeled antibodies compete for the same binding sites on the analyte. Using equal amounts of each labeled antibody allows the greatest probability of binding the analyte with a biotinylated antibody and a fluoresceinated antibody. Fifty ng/test of each labeled antibody represented the best compromise between minimum background rate (0 pg/mL Protein A) and maximum slope in the presence of analyte (50 and 500 pg/mL Protein A). This antibody combination was used for the remainder of the experiments in this application note.
Assay protocol
Step 1 Prepare the Protein A standard curve in polypropylene tubes. Make dilutions of the Protein A standard in Assay Buffer. The standards range from 20 pg/mL to 5000 pg/mL.
Step 2 Dilute samples with Assay Buffer in polypropylene tubes.
Step 3 Prepare a mixture of the biotinylated and fluoresceinated antibodies, each at a concentration of 50 ng/test (500 ng/mL) in Assay Buffer in a single polypropylene tube.
Step 4 Dispense 100 µL of each Protein A standard and each sample into the appropriate tubes.
Step 5 Dispense 100 µL of the antibody combination prepared in Step 3 into the tubes using an Eppendorf Repeater Pipetter and a Combitip®.
Step 6 Cover the tubes with Parafilm®, shake the rack to mix, and incubate for 2 hours at room temperature.
Step 7 Reconstitute the Capture Reagent with 25 mL of Assay Buffer. Prepare a 1:10 dilution of the reconstituted Capture Reagent with Assay Buffer (1 volume Capture Reagent + 9 volumes Assay Buffer). When the incubation is complete, dispense 1 mL of the diluted Capture Reagent into each tube using an Eppendorf Repeater Pipetter and a Combitip.
Step 8 Transfer the reaction mixtures to the filtration units. The filter bases and filter blocks may be either new or re-used (see ILA Detection Kit package insert for cleaning instructions). Filter on low vacuum.
Step 9 During the filtering step, reconstitute the Enzyme Reagent with 4 mL of Assay Buffer per vial. Prepare a 1:10 dilution of the reconstituted Enzyme Reagent (1 volume of Enzyme Reagent + 9 volumes of Assay Buffer).
Step 10 When the wells of the filtration units are empty, dispense 2 mL of Wash Buffer into each well and filter on high vacuum. Turn off the vacuum.
Step 11 Dispense 1 mL of the diluted Enzyme Reagent into each well with an Eppendorf Repeater Pipetter and a Combitip and filter on low vacuum.
Step 12 When the wells of the filtration units are empty, dispense 2 mL of Wash Buffer into each well and filter on high vacuum.
Step 13 When the wells are empty, turn off the vacuum and read the sticks.
Assay Characterization
Standard curve
The lowest calibrator of the standard curve was selected by calculating the concentration of recombinant Protein A that would produce a 30–50 µV/sec increase over the background rate. The calculation was made using the slopes observed in the loading study. The other calibrators were distributed evenly overthe acceptable range of the assay, 20 pg/mL to 5000 pg/mL (Figure 1 shows a standard curve with Protein A concentrations of 5000, 2500, 1250, 625, 156, 40, 20 and 0 pg/mL). A quadratic equation best defined the standard curve.
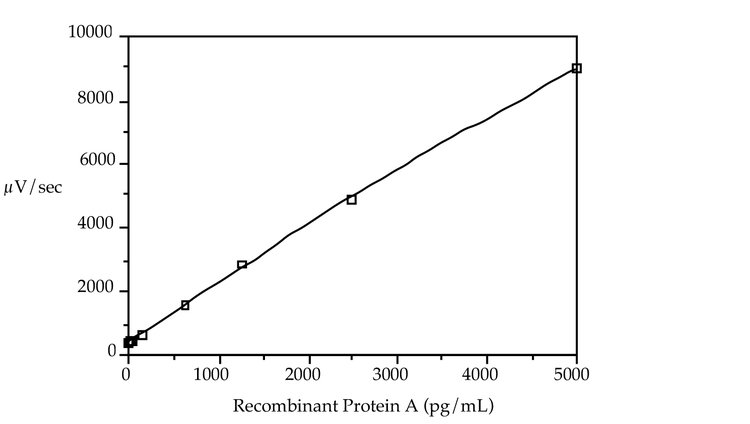
Figure 1: Recombinant Protein A standard curve
Incubation time
A kinetic study was performed to determine optimum incubation time. Four levels of analyte (0 pg/mL, 100 pg/mL, 700 pg/mL, 2000 pg/mL) were incubated with labeled antibody for 30 minutes, 1 hour, 1.5 hours, 2 hours and 4 hours. The standard curve, * (0 pg/mL) and # (1250 pg/mL) samples for all sticks were incubated for 4 hours. The reaction had not reached equilibrium at 4 hours (Figure 2). A 2 hour incubation time was chosen for the remainder of the experiments in this application note, both for convenience and because sufficient dynamic range was obtained. If the selected incubation time differs from that used originally to characterize the standard curve, the standard curve range may need to be redefined using the new incubation time.
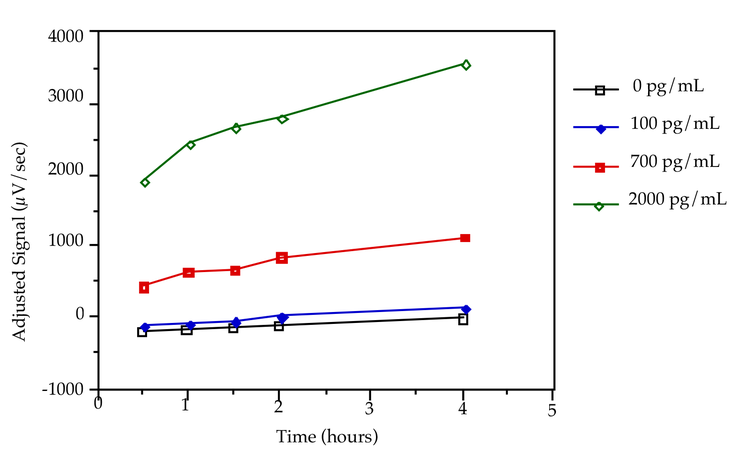
Figure 2: Effects of incubation time on signal
Limit of detection
See the Threshold System Operator's Manual for information on evaluating the limit of detection. This specific assay allows detection of 20 pg/mL Protein A with a four standard deviation separation from the background.
Applications
Assay performance was examined in the presence of several antibody species and subclasses: MuIgG1, MuIgG2a, MuIgG2b, and HuIgG. Spike recovery and limit of detection of recombinant Protein A was determined in the presence of these product antibodies.
Spike recovery in the presence of product antibody
Recovery of a 500 pg/mL spike of recombinant Protein A was tested in the presence of a range of concentrations of different species and subclasses of antibodies. A buffer control was included in each experiment. Percent spike recovery was calculated as follows:

Acceptable spike recovery was defined as 100% ± 20%. The concentration of each sample antibody that allowed full spike recovery is listed in Table 1.
MuIgG
1
MuIgG
2a
MuIgG
2b
HuIgG
*
Table 1: Spike recovery in the presence of product antibody.*Subclass of HuIgG unknown
Limit of detection determined in the presence of product antibody
The limit of detection in the presence of each species and subclass of antibody was determined using the concentration of each sample antibody listed in Table 1. The detection limit is expressed in parts per million (ppm), or parts per billion (ppb) mass of Protein A/mass of antibody (Table 2).
Limit of detection
(results of 2 experiments)
MuIgG
1
MuIgG
2a
MuIgG
2b
HuIgG
*
Table 2: Limit of detection in the presence of product antibody. *Subclass of HuIgG unknown
Summary
The data in this application note were generated using a 2 hour incubation time and 50 ng/test of each labeled antibody. These conditions yield a sensitive (25 ppb to 4 ppm), quantitative assay with a wide dynamic range (2.5 logs) for measuring contaminant Protein A. The assay conditions may be modified to meet different assay requirements. For example, greater sensitivity may be achieved using a longer incubation time. Conversely, a very rapid assay with less sensitivity may be developed using a shorter incubation time. The limit of detection levels determined for the various product antibodies tested may not be representative of all antibodies. Validation of assay performance, particularly the limit of detection, should be determined for each product antibody tested.
References
1 Harlow E. and Lane D. Antibodies: A Laboratory Manual. Cold Spring Harbor pp. 615-622 (1988).