
Application Note
Automated Optimization of IgG Production in CHO Cells
Michael Kowalski, Staff Applications Scientist | Beckman Coulter Life Sciences, Indianapolis, IN
David Apiyo, Marketing Applications Manager| Pall ForteBio, Fremont, CA
Rashi Takkar, Product Manager| Pall ForteBio, Fremont, CA
Tara Jones-Roe, Marketing Manager| Beckman Coulter Life Sciences, Indianapolis, IN

Introduction
Monoclonal antibodies have long been an essential tool for cell and molecular assays and have moved into the clinic as part of a shift from small molecules into biologic treatments for disease. Antibodies are typically produced from a cell line that has been screened to ensure the protein is expressed with the desired post-translational modifications, target specificity and affinity, and at relatively high levels. Once this producing line has been identified, one can achieve higher titers by optimizing the culture media to increase cell growth and/or protein production.
Perhaps the most common cells for protein production are Chinese hamster ovary (CHO) cells, which can grow in adherent or suspension cultures, the latter of which allows for more cells per unit of media and culturing in bioreactors. A number of “optimized” media for culturing CHO cells are commercially available,however, each expression clone may have different conditions that will maximize protein production such that these media may be suboptimal.
An ideal approach to media optimization is using a factorial design of experiment (DOE), where a variety of media components are tested at different concentrations in combination with one another. However, these factorial experiments rapidly increase the number of conditions that require testing. Common ways of quantifying the production of IgG or other proteins are frequently labor intensive (i.e. ELISAs) or prohibitively slow (i.e. HPLC), particularly at the high throughputs required for DOE. In contrast, the Octet platform (Pall ForteBio, Figure 1) uses Bio-Layer Interferometry to detect real-time binding of molecules as a means of quantification or kinetic analysis. This technology essentially eliminates any sample preparation beyond an optional dilution step, and the high throughput models can process up to 96 samples simultaneously.
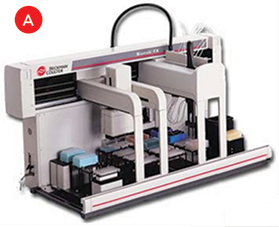
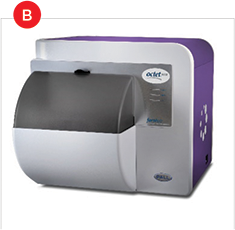

Figure 1. Automated IgG Optimization. Factorial combinations of media supplements were created on the Biomek FXP Workstation (A) and CHO cell IgG titers were analyzed on the Octet HTX system (B). Cell counts and XTT absorbance were measured on the SpectraMax i3x Multi-Mode Platform with SpectraMax MiniMax 300 Imaging Cytometer (C).
Here we show how coupling this high throughput IgG analysis with the Biomek FXP Automated Workstation (Figure 1) enabled the DOE optimization of IgG expression in a CHO cell line. The Biomek FXP Workstation was used to prepare 96 media combinations and plate cells in replicate conditions, generate sample and reagent plates for the Octet HTX system, and initiate XTT assays to better understand the effect of media components on CHO cell growth.
Summary
- Increased IgG production\~50% through design of experiment (DOE) optimization of media components
- Automated the creation of 96 media conditions, cell plating, and assay preparation on a Biomek FX P Workstation
- Analyzed IgG titer in 384 wells in under 20 minutes using an Octet ® HTX system
- Determined which factors drive IgG increase through cell growth
- Imaged cells on a SpectraMax ® MiniMax 300 Imaging Cytometer
- Automated XTT assays with analysis on a SpectraMax ® i3x Multi-Mode Platform
Materials and Methods
CHO Cell Culture
CHO DP-12 clone #1934 (ATCC) is a CHO line stably expressing recombinant human IgG1 antibodies against Interleukin 8. CHO cells were maintained under adherent conditions in DMEM + GlutaMAX (Thermo Fisher), 10% fetal bovine serum (Thermo Fisher), 2 μg/mL recombinant human insulin (Sigma), 0.1% Trace Elements A and B (Corning), and 200nM methotrexate (Sigma). Cells were cultured at 37°C and 5% CO2.
Factorial DOE Media Optimization
Basal media for optimization experiments was CD OptiCHO (Thermo Fisher). Repeated passaging in OptiCHO caused cells to grow in suspension, however an initial plating maintained adherent characteristics. This adherence allowed image-based cell counting and prevented cell transfer during media sampling for IgG analysis.
Additional components tested for enhancement of IgG production include Polyamine, SPITE, MEM Non-essential Amino Acid Solution, Bioreactor pH Adjustment Solution (“bioreactor buffer”, all from Sigma Aldrich), GlutaMAX, HEPES, and CHO CD EfficientFeed A (all from Thermo Fisher).
We utilized a Biomek FXP Workstation featuring Span-8 pipettors and a 96-channel head with enhanced selective tip (EST) functionality to generate factorial combinations of media components (see Figure 2 for workflow). The EST feature enables any combination of tips to be loaded on the multichannel head, which aided the factorial approach when stamping sets of 4, 16, or 48 wells at once. The Biomek Workstation was contained within a HEPA-filtered enclosure to maintain the sterility of the cell cultures during manipulation.
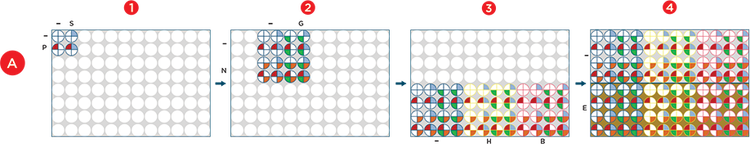
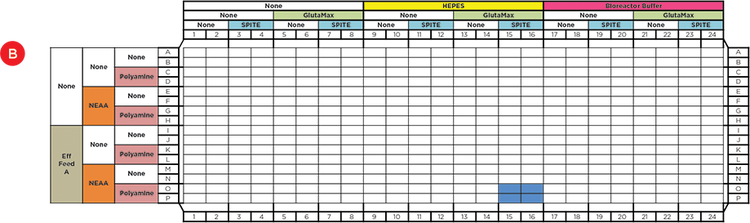
Figure 2. Automated Factorial Approach. A) The Span-8 pipettors were used to dispense reagents into deep well plates in all steps and the enhanced selective tip multichannel pod was used to stamp 4, 16, or 48 wells of previously combined reagents into the newly plated reagents. Briefly, 1) Media (-), Polyamine (P) and SPITE (S) were combined into 4 wells, 2) Media (-), GlutaMAX (G) and NEAA (N) were combined into 16 wells and the Polyamine/SPITE wells were stamped into the 4 well quadrants. 3) Media (-), HEPES (-) and bioreactor buffer (B) were dispensed into 16 wells each and the 16 mixture wells were dispensed to each reagent. 4) Media (-) and Efficient Feed A (E) were dispensed to 48 wells of a second plate and the 48 mixture wells were stamped into each. B) The final 96 conditions were plated into a 384-well plate in quadruplicates and cells were added to each condition. The blue colored wells represent the quadruplicate wells that were supplemented with Polyamine, SPITE, GlutaMAX, NEAA, HEPES, and EfficientFeed A.
The resulting 96 conditions were plated in quadruplicate wells of a 384-well clear-bottom plate. 40,000 CHO cells were then plated in each well for a total volume of 100 μL/well. Creation of the media combinations and cell plating was completed in 20 minutes. Cells were incubated at 37°C, 5% CO2 for 2-4 days prior to IgG and growth analysis.
IgG Quantification
For IgG quantification, we utilized the Biomek FXP Workstation to transfer 50 μL of cell media from the culture plate to a 384-well black tilted-bottom plate (Pall ForteBio). Samples were then analyzed on an Octet HTX system using Protein A Dip and Read™ Biosensors to bind IgG directly from the media. Probes were first hydrated with basal OptiCHO media and regenerated between quadruplicate wells with 10mM glycine, pH 1.7 and neutralized with basal OptiCHO media. Hydration and regeneration/neutralization plates were also prepared by the Biomek FXP Workstation. The entire automated process was completed in under 7 minutes and processing of 384 samples took less than 20 minutes on the Octet HTX system when using 96 biosensors.
The 700 μg/mL Protein A Calibrator (Pall ForteBio) was serially diluted to a range of 0-50 μg/mL in OptiCHO and triplicate wells were assayed using Protein A biosensors. A standard curve was generated with these calibrators using the initial slope for the binding rate algorithm and a five parameter logistic curve (weighted Y2) to calculate the response from sample wells. Since sample wells would have different media makeups, each media additive was tested with the calibrators to ensure they did not significantly affect the IgG signal or baseline.
Cell Growth Analysis
Upon initial plating and prior to sampling for IgG analysis, culture plates were imaged on a SpectraMax i3x Multi-Mode Platform with SpectraMax MiniMax 300 Imaging Cytometer (Figure 1). One brightfield image per well was acquired and cells were enumerated using StainFree Cell Detection Technology with the available CellsC setting.
Because changes in the morphology of CHO cell colonies under different media conditions could affect cell counts, we sought to verify cell growth results with an XTT assay. Following media sampling for IgG analysis the Biomek FXP Workstation added 15 μL XTT reagent (Cell Signaling) to the cells and the culture plate was returned to 37°C. Absorbance was measured on the SpectraMax i3x Multi-Mode Platform at 475 nm and 660 nm after 1-4 hours of incubation.
Data Analysis
Replicate values were averaged and imported into Design-Expert 8.0.2 software (Stat-Ease) to identify factors that have significant effects on cell growth or IgG production, either alone or in combination with one another. In addition, Design-Expert was used to predict what conditions would maximize IgG production.
Results
The main goal of this optimization approach was to determine the conditions that will promote the highest level of IgG production. However, increased IgG production can be achieved by increasing the per-cell output and/or by accelerating cellular expansion. Hence we analyzed both cell growth and IgG titers to distinguish between these effects.
Image analysis of the plate 30 minutes after plating confirmed consistent cell numbers across the plate (CV = 6.1%), ensuring any differences detected are due to media composition. Figure 3 shows the quantification of the IgG titers following four days of incubation in 96 different media conditions. One confounding factor in measuring IgG concentration was that evaporation reduced the volume in wells on the edge of the plate. The two highest outlier wells (Figure 3C) were both corner wells and quadruplicates with edge wells had a much higher CV (9.6%) than internal quadruplicates (2.9%). Because this effect was so significant, exterior wells were excluded from the calculations. Resulting average titers ranged from 7.8 to 14.6 μg/mL, with basal OptiCHO media producing 8.8 μg/mL IgG. This indicates that after a single round of media optimization we were able to identify conditions that could enhance IgG production by 66%.
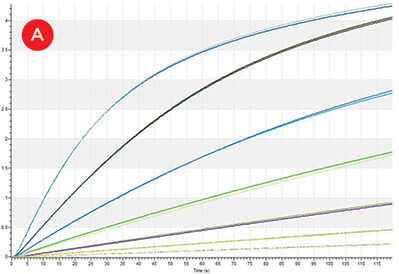
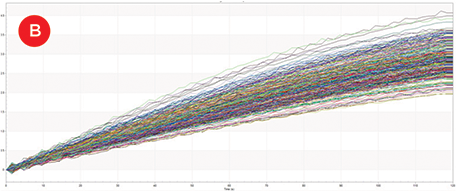
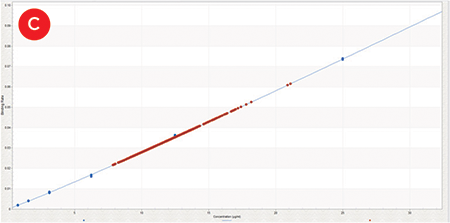
Figure 3. IgG Titers. A) Replicate binding curves of 1:2 dilutions of Protein A Calibrator (50-0.78 μg/mL) as measured by Protein A biosensors on the Octet HTX. B) Protein A biosensor binding curves of IgG molecules generated from one replicate of each of the 96 growth conditions. C) All 384 sample IgG concentrations (orange) plotted on the calibrator curve (blue, 0-25 μg/mL).
Statistical design software was used to identify the factors that had significant effects on IgG titer – either alone or in combination with one another (Table 1). In isolation, Polyamine and GlutaMAX increased IgG production, bioreactor buffer decreased production, and SPITE, HEPES, and EfficientFeed A had negligible effects. However, Figure 4 illustrates the significant interaction that SPITE had with both GlutaMAX and bioreactor buffer. SPITE actually reduced the positive effect of GlutaMAX in unbuffered conditions (Figure 4A) but SPITE combined with bioreactor buffer had significant positive effects (Figure 4B) and the highest IgG production was achieved by the combination of all three factors (Figure 4C). This shows the advantage of factorial analysis, as neither SPITE nor bioreactor buffer would have been taken forward if each factor was first assayed alone.
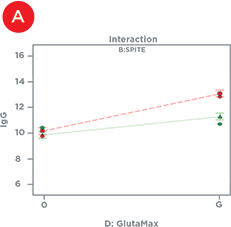
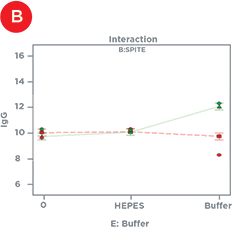
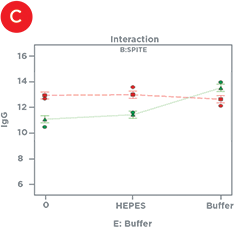
Figure 4. Supplement Interactions. A) The positive effect of GlutaMAX on IgG titer (red line) is reduced by the presence of SPITE (green line). B) SPITE (green line) increases IgG titer only in the presence of bioreactor buffer. C) SPITE (green line) enhances the GlutaMAX IgG titer (red line) in the presence of bioreactor buffer. This condition would likely have been missed without a factorial approach.
To investigate potential mechanisms of IgG increase, we analyzed effects of supplements on cell growth using the statistical design software. We found that GlutaMAX and SPITE significantly increased cell counts on the SpectraMax MiniMax cytometer individually and had a greater effect in combination while EfficientFeed A reduced cell counts (Table 1). Figure 5 shows that the CHO cells predominantly grew in three-dimensional clusters in OptiCHO media. GlutaMAX appears to increase the size of the colonies while SPITE seems to alter the colony morphology and/or increase the number of individual cells growing between colonies. Because of the three-dimensional nature of the cell colonies, changes in cell numbers could be under-or over-reported by imaging, therefore we utilized XTT assays as an additional means of quantifying the relative number of cells.

Figure 5. Effect of supplements on cell growth. Images from SpectraMax MiniMax cytometer showing CHO cell colonies in basal OptiCHO media (A). (B) The presence of GlutaMAX increases the size of the CHO colonies while the addition of SPITE leads to more cells between colonies (C). The combination of SPITE and GlutaMAX results in more cells than either additive alone (D).
Again, to avoid the effects of evaporation on edge wells we only used interior wells for XTT analysis. Similar to the results we saw from cell imaging, GlutaMAX had a significant positive effect but SPITE only increased XTT absorbance in the presence of bioreactor buffer. The effect of GlutaMAX was also increased in the presence of bioreactor buffer. Interestingly, Efficient Feeder A was shown to have a positive effect on XTT absorbance but this effect was neutralized by the presence of SPITE. Finally, HEPES was shown to have a negative effect on XTT signal (Table 1). It is also possible that media differences could confound the XTT results (i.e. buffers/pH could affect the reaction chemistry) but for conditions such as GlutaMAX addition, the reinforcement of imaging results provides stronger evidence of an effect on cell growth.
Table 1: Effects of supplements on IgG titer and cell growth.
Increases indicated by “+” symbol, reductions indicated by “-“ symbol, and no symbol indicates no effect.
Finally, we used the statistical design software to create a model from the 96 data points to predict the optimal condition for IgG expression. This modeling reduces the likelihood of utilizing a “false positive” as the de facto best condition by simply taking the condition that gave the highest concentration in a single experiment. Based on the model, a media supplementation with Polyamine, SPITE, GlutaMAX, and Bioreactor pH Adjustment Solution would be predicted to generate 13.6 μg/mL IgG, a 42% increase over a predicted 9.6 μg/mL production in basal OptiCHO medium.
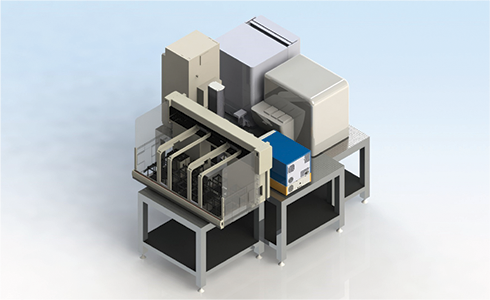
Figure 6. High-throughput protein analysis system. A 3D rendering demonstrating how an Octet HTX system and SpectraMax i3x Multi-Mode Platform with SpectraMax MiniMax cytometer can be integrated with a Biomek FXP Workstation, along with storage and incubators, to enable high-throughput sample processing and analysis. Octet results can drive subsequent liquid handling steps (i.e. clone hit expansion) on the Biomek FXP Workstation without intervention.
Discussion
Here we have shown how media optimization can improve CHO cell growth and protein production. By utilizing a factorial design of experiment we were able to identify conditions that improved antibody titer by 42-66% over a commercial medium that is optimized for CHO culture. We were also able to identify those factors that did not enhance expression and thereby reduce the costs of production cell culture by not including these supplements in the medium. By testing combinations of all supplements we were able to identify positive combinations that would not have been identified by testing supplements in single fashion. However, these factorial combinations are challenging to achieve in a manual fashion. This experiment would have required 184 manual transfers using a combination of single and 8-channel pipettes and this could grow significantly for more elaborate combinations. Not only does automation reduce the significant opportunity for errors in this approach, but the time a scientist would spend at the bench executing these steps can now be spent designing experiments and analyzing data.
By analyzing cell growth in addition to IgG titer, we were able to distinguish between factors that primarily affected cell growth (GlutaMAX, SPITE) from those that drove IgG production without affecting growth (Polyamine). This additional information suggests that a step-wise addition could be beneficial, whereby cell growth would first be stimulated, followed by a switch to protein production. In addition, there is likely a balance between these two effects, such that too much cell growth may reduce the energy available for producing IgG or so much energy is dedicated for protein production that cell growth slows. Once again, the factorial approach is more likely to identify the conditions that could provide the optimal balance.
Another consideration when utilizing this type of DOE approach is that the various supplements might affect the analysis. One example is that the addition of a Linoleic Acid/Oleic Acid/Albumin supplement (Sigma Aldrich) shifted the baseline on the Octet readings, even in the absence of cells or standards. Because not all wells would have this supplement, it would be difficult to identify legitimate increases in IgG production in these wells from false positives, and therefore this reagent was not included in the screen. As described above, it is also possible that different factors will have effects on the characteristics of the adherent cell colonies that could skew imaging cell counts or could affect the XTT reactions, thus it is useful to have multiple analyses when predicting mechanisms of action.
Other confounding factors include the evaporation effect in edge wells as described earlier. One way to minimize this effect is to look at shorter time periods. For example, at 2 days of culture, the replicate CVs for IgG titers for inner wells was 2.5% while those conditions with edge wells was only 3.8% (vs. 9.6% at day 4). However, longer culture times are more likely to identify conditions that might better translate to a bioreactor, where culture times can stretch to weeks. Options for minimizing edge effects include utilizing plates that have evaporation wells, or as we did here, eliminating the edge well values from consideration. One could also utilize the EST feature of the multichannel head of the Biomek FXP Workstation to only add reagents and cells to the 308 interior wells of the 384-well plate and then add water to the remaining 76 wells around the circumference of the plate. The EST function also allows the opportunity to leave wells available for the inclusion of a standard curve on each plate if that is preferable to utilizing a previously established standard curve for post-run analysis. A final approach to reducing evaporation effects would be to utilize the liquid level sensing capability of the Biomek Span-8 pipettors to calculate the volume of each well and then normalize the volumes prior to analysis, however, this would be a rate-limiting process compared to other steps in this IgG analysis.
Because of the ease of sample preparation and rapid processing of samples, the Octet HTX system is an excellent option for higher throughput applications such as expression clone screening. To enable a complete high-throughput workflow, we have integrated the Octet HTX system to the Biomek FXP Workstation (Figure 6). This configuration can automate the direct loading, processing, and analysis of protein quantification or kinetic studies. The system also has the ability to utilize the results to drive additional liquid handling steps, such as expanding high expressing clones to larger wells. By combining the liquid handling power of the Biomek FXP Workstation with the Octet HTX system one can minimize time, effort, and costs in protein production optimization and analysis.
Learn more about SpectraMax i3x Multi-Mode Detection Platform >>