
Application Note
Noninvasive measurement of fluorescent proteins in live cells
- Easily and noninvasively measure fluorescent proteins in living cells
- Tune wavelengths to get optimal results for each individual fluorophore
- Read from the bottom for best sensitivity
Introduction
Fluorescent proteins have become enormously popular as tools for monitoring biological events in vivo. Green fluorescent protein (GFP) from the jellyfish Aequorea victoria was the first protein of choice, but there are now numerous others available, including enhanced GFP variants, fluorescent proteins from other species of jellyfish and reef coral proteins. They can be cloned in a diverse range of cells and organisms, from bacteria and yeast to plants and mammals. The fluorescent proteins are stable, have minimal toxicity, and have the ability to generate visible fluorescence in vivo without the need for external cofactors. They can be used as molecular tags or as independent reporters to visualize, track and quantify many different cellular processes, including protein synthesis and turnover, protein translocation, gene induction, and cell lineage. The various proteins have different colors, so they can be used in multiplexed assays. They can be monitored by fluorescent microscopy and flow cytometry. If there is no need to physically sort the cells or to monitor intracellular migration, microplate fluorometry offers a preferable, more convenient and higher-throughput detection system. Here, we show that Molecular Devices microplate readers can easily and noninvasively measure fluorescent proteins in living cells.
We obtained three HEK-293 cell lines from Clontech, each stably transfected with a different fluorescent protein. The purposes of the study were: 1) to determine the optimal wavelength settings for three cell lines, 2) prepare dilution series of each cell line to estimate lower limits of detection (LLD), and 3) demonstrate feasibility of discriminating one cell line in the presence of another.
Materials
- HEK-293 cell lines stably expressing fluorescent proteins were obtained from Clontech:
- AcGFP—a variant of GFP cloned from Aequorea coerelescens (a jellyfish distinct from A. victoria)
- ZsGreen—similar to GFP, but brighter (from reef coral)
- DsRed—a red-shifted fluorescent protein cloned from reef coral
- HEK-293 cell line non-transfected (ATCC cat. #CRL-1573)
- DME: High Glucose (Irvine Scientific cat. #9024)
- G418: Geneticin (Gibco cat. #11811-031)
- FBS (Irvine Scientific cat. #3000A)
- Glutamine/Pen/Strep Solution (Gibco cat. #10378-016)
- Trypsin/EDTA 1X in HBSS (Irvine Scientific cat. #9341)
- 10X Hank’s Balanced Salt Solution (Gibco cat. #14065-056)
- 1M HEPES (Irvine Scientific cat. #9319)
- HBSS Buffer (1X Hank’s Balanced Salt Solution with 20 mM HEPES buffer): Made from 10X Hank’s Balanced Salt Solution (100 mL), 1M HEPES (20 mL) and water for cell culture (880 mL)
- Water for cell culture (Irvine Scientific cat. #9312)
- Black-wall clear-bottom 96-well microplate (Corning cat. #3603) or Black-wall clear-bottom 384-well microplate (Corning cat. #3712)
- SpectraMax ® M5 Multi-Mode Microplate Reader (Molecular Devices)
- Gemini EM Microplate Reader (Molecular Devices)
Methods
Cell preparation and analysis
The cells were cultured in bulk flasks in DME + 10% FBS + 1% Pen/Strep/L-glutamine + 500 µg/mL of G418. Non-transfected HEK cells were included as controls. The night before the experiment, they were trypsinized and the cell suspension was diluted serially to give cell densities ranging from 500,000 down to 100 cells per mL. They were seeded overnight in 96-well (100 µL/well) and 384-well microplates (25 µL/well). Thus the seeded cell densities were 50,000 to 10 cells/well (96-well plate) and 12,500 to 2.5 cells/well (384-well plate). There were 12 replicate wells per dilution in both 96-well and 384- well plates. The microplates were read the next day from the bottom and the top in SpectraMax M5 and Gemini EM readers.
Wavelength optimization
Both the SpectraMax M5 and the Gemini EM are monochromator-based, microplate readers. The excitation and the emission wavelengths on these instruments can be tuned for optimal signal over background for each unique fluorophore, offering an advantage over filter-based instruments. In general, the strategy is to do a preliminary emission scan with the excitation wavelength set 20-25 nm below the expected Ex λmax and an excitation scan with the emission wavelength set 20-25 nm above the Em λmax. These two scans should give the actual Ex and Em λmax values. Additional scans are then done to determine the excitation and emission wavelength combination giving optimal signal/background for quantitative analyses. (Depending on the Stokes shift, the Ex wavelength will be lowered and the Em wavelength raised and an emission cutoff filter used to block unwanted excitation light). Sometimes it is necessary to do the final emission scans twice in order to choose between two different cutoff filters.
Results
Wavelength optimization
The DsRed wavelength scans in a Gemini EM reader are shown below as an example of the wavelength optimization procedure. To determine the excitation λmax, an excitation scan was done with the emission wavelength set to 600 nm. The resulting scan showed the excitation λmax to be 556 nm (Figure 1).
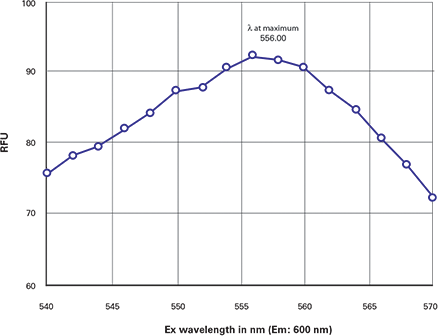
Figure 1. DsRed excitation scan. Excitation scan of DsRed showing the λmax = 556 nm.
To determine the emission λmax, an emission scan was done with the excitation wavelength set to 535 and the scan revealed the emission λmax to be 584 nm (Figure 2). The Ex and Em λmax values were close to the published values of 557/579.
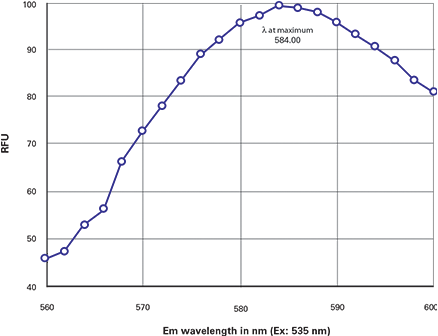
Figure 2. DsRed emission scan. Emission scan of DsRed showing the λmax = 584 nm.
The next steps were done to determine the best Ex and Em settings for optimal signal/ background. Because the Stokes shift was small (22 nm), it was obvious that it would be necessary to lower the excitation wavelength, raise the emission wavelength to increase the separation between the two and also to use an emission cutoff filter for best sensitivity. Accordingly, the excitation wavelength was lowered to 550 nm and the 570 nm emission cutoff filter was selected to block unwanted excitation light above 570 nm. An emission scan between 575 and 600 nm showed a peak of approximately 587-588 for the DsRedtransfected cells (Figure 3, upper curve). The background (non-transfected cells) showed a relatively flat plot in that region (Figure 3, lower curve). Based on this scan, the optimized settings were deemed to be Ex/Em = 550/588 with a 575 nm emission cutoff filter.
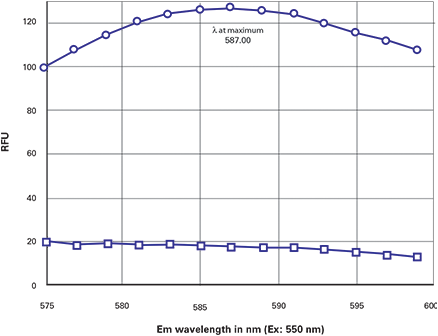
Figure 3. Optimization of DsRed settings. Emission scan was done with a 570 nm cutoff filter and Ex set to 550 nm. Top curve = transfected cells. Bottom curve = control cells. Final optimized settings: Ex/Em = 550/588 + 570 Emission cutoff.
The observed lambda maxima and our recommended settings for quantitative analysis are summarized in Table 1.
Published λ
maxima
Observed λ
maxima
Ex λ
max
Em λ
max
Ex λ
max
Em λ
max
Table 1. Summary of observed lambda maxima and recommended settings. *The M5 and Gemini EM have subtle differences in their optics. For the Gemini EM, the recommended settings for AcGFP and ZsGreen are Ex/Em 480/510 with a 495 cutoff filter.
Cell dilution series
The results from the dilution series when read from the bottom are shown in Figure 4 (96-well) and Figure 5 (384-well). The top read results are shown in Figure 6 (96- well) and Figure 7 (384-well). The ZsGreen cell line (upper curve) was approximately 3.5 times brighter than the other two. Although the DsRed cell line was dimmer than the ZsGreen, the limits of detection were similar for the two lines (Table 2) because the background was lower at the DsRed wavelengths.
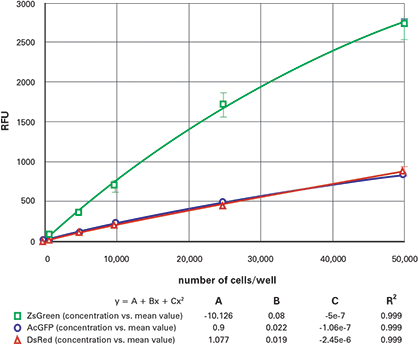
Figure 4. 96-well fluorescent cell dilution series, bottom-read. Dilution series for ZsGreen (green), AcGFP (blue) and DsRed (red) transfected cells in 96-well plates, read from the bottom.
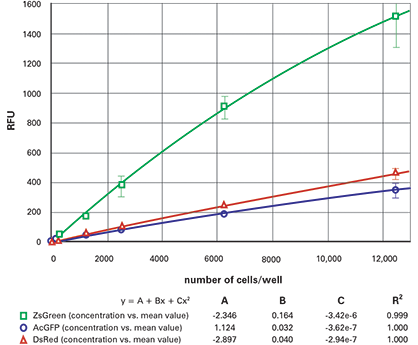
Figure 5. 384-well fluorescent cell dilution series, bottom-read. Dilution series for ZsGreen (green), AcGFP (blue) and DsRed (red) transfected cells in 384-well plates, read from the bottom.
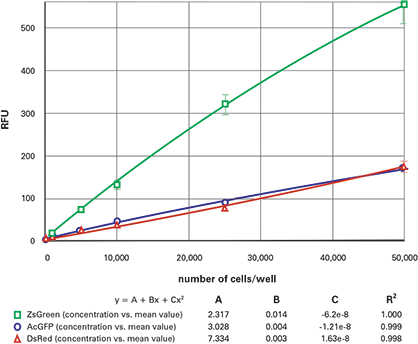
Figure 6. 96-well fluorescent cell dilution series, top-read. Dilution series for ZsGreen (green), AcGFP (blue) and DsRed (red) transfected cells in 96-well plates, read from the top.
| Bottom Read (#Cells/Well) | |
| 96-Well | 384-Well |
| Top Read (#Cells/Well) | |
| 96-Well | 384-Well |
Table 2. Summary of estimated lower limits of detection.* *Results are expressed in terms of #cells/well. To convert to #cells/mm2, divide the 96-well values by 129 mm2/well and the 384 values by 25 mm2/well.
In general, the plots were slightly nonlinear, dropping off at the upper end. We speculate that this might be due to the tendency of cells at high density to migrate up the microplate walls and therefore be out of the beam.
Table 2 gives the estimated lower limits of detection (LLD) for each of the cell lines. The calculation for the LLD was: 3SDBlank/ slope, where SDBlank is the standard deviation of Blank wells (media without cells) and the slope is the slope of the curve at the bottom end. (For the 96-well and 384-well plates respectively, the 10,000 cells/well and 2500 cells/well data points were used, respectively.) The RFU signal and standard deviation of wells containing non-transfected cells were similar to those containing media only.
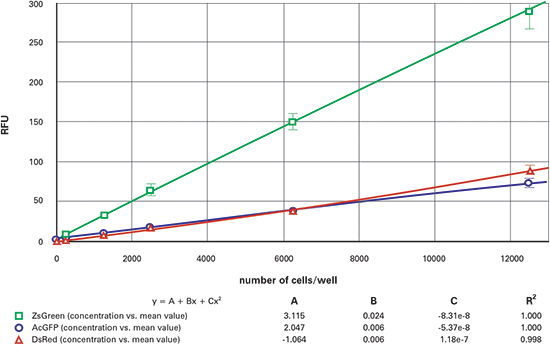
Figure 7. 384-well fluorescent cell dilution series, top-read. Dilution series for ZsGreen (green), AcGFP (blue) and DsRed (red) transfected cells in 384-well plates, read from the top.
In this particular experiment, ZsGreen and DsRed cell lines had similar limits of detection in bottom-read mode and both were 3 to 4 times lower than the LLD for the AcGFP line. This experiment was performed 3 times and DsRed did not always perform so well. In one experiment, its LLD was similar to that of AcGFP and in the other experiment, its LLD was much higher. We attribute these differences to the fact that the number of passages differed between the cell lines. (With each successive passage, the cells become dimmer.) The DsRed cell line grew more quickly than the others in the early experiments, so in the first experiment, it had 2-4 more passages than the other cell lines, resulting in its apparently poorer performance
For the AcGFP and ZsGreen cell lines, the LLDs were approximately 3 times higher when read from the top. The DsRed, on the other hand, was 10-20 times higher when read from the top. We attribute the decreased sensitivity to the interference from the DMEM which has significant red-shifted fluorescent signal. Indeed, replacement of the colored media with colorless HBSS improved the DsRed topread results.
Table 3 shows the results from a previous experiment where the culture media was removed and replaced with colorless buffer. The bottom-read results did not change (though the AcGFP LLD seemed to improve), indicating that there was no appreciable loss of cells as a result of the manipulation. Top-read results, however, improved about threefold. These results support the assumption that colored media is partly responsible for the poorer sensitivity in topread mode.
Table 3. Effect of replacing media with colorless HBSS on limits of detection (#Cells/Well) in 96-well microplates in the Gemini EM Reader.
Cell mixtures
In this experiment, in a 96-well plate, the wells contained various mixtures of cells and the total number in each well was 50,000 cells. Thus a 1:1 mixture contained 25,000 of each cell type and a 1:1:1 mixture contained 16,700 of each cell type. The plate was read at Ex/Em 480/510 (optimal for AcGFP and ZsGreen) and 550/588 (DsRed settings). The observed RFU values were similar to predicted values. The results indicate that AcGFP or ZsGreen can be measured in the presence of DsRed and vice versa (Table 4).
Table 4. Results obtained with mixtures of cells.
Conclusion
Microplate readers from Molecular Devices can easily detect fluorescent proteins in intact adherent cells. They offer the benefit of tuning the wavelengths to get optimal results for each individual fluorophore. Bottom reading give better sensitivity, though top reading gives usable results, especially for the ZsGreen- and DsRedcontaining cell line. Top-read results for the DsRed cell line can be improved by replacing the media with colorless HBSS buffer.