
Application Note
Toxicity assays using induced pluripotent stem cell-derived cells
- Screen for toxicity in 96- or 384-well format easily and rapidly, using percentage of well area covered
- Follow a familiar microplate reader workflow
- Have confidence in the data output since the cells can be visualized
Introduction
Drug-induced organ toxicity is an important cause of pharmaceutical candidates failing to make it to market. Thus highly predictive assays for safety and efficacy testing are crucial for improving drug development and reducing drug candidate attrition. Human induced pluripotent stem cell (iPSC)-derived hepatocytes and neurons, which exhibit typical characteristics and metabolism of mature cells, are ideal for use in high content screening in early drug development.
Although protocols for performing standard cytotoxicity assays using luminescence or fluorescence readout on microplate readers are well-known, even more information can be gained by using an imaging cytometer to actually view the cells.
Getting more information from a standard viability assay
Viability dyes, such as Calcein AM, can be used to address gross compound toxicity in live cells. Calcein AM only fluoresces green inside live cells that exhibit functional esterase activity. iPSC-derived human hepatocytes were first treated with various compounds for 24-hours then stained with Calcein AM. Images of live cells were acquired using SpectraMax® MiniMax™ Imaging Cytometer, an upgradable option for the SpectraMax® i3 Multi-Mode Detection Platform. The green cytoplasmic area of living cells was identified using the Cell Proliferation Protocol in SoftMax® Pro Software (Figures 1 and 2) and IC50 values were determined using the software’s curve fit function (Figure 3).
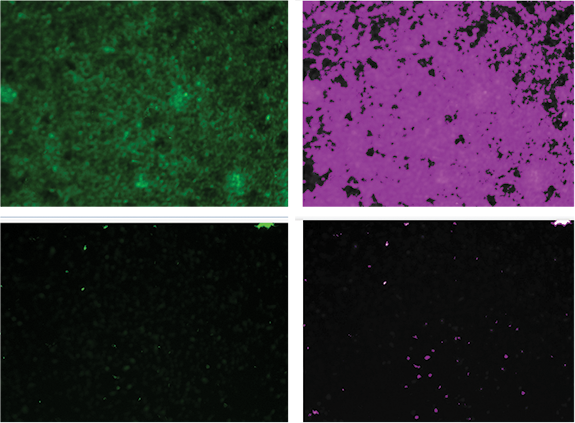
Figure 1. A viability dye allows live cell measurement. Live cells stained with Calcein AM are identified with a SoftMax Pro Software Cell Proliferation Protocol. This assay is used to calculate the percentage of wells covered by live cells. The purple masks on the right show segmentation of live cells which are visible in the images on the left.
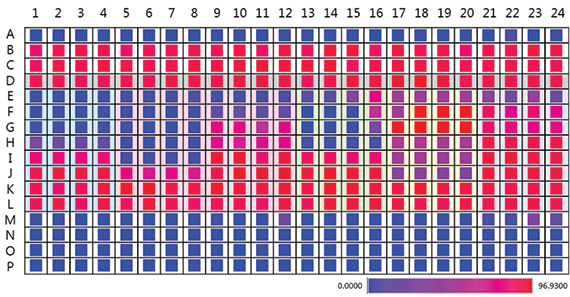
Figure 2. Determine live cell confluency at a glance. In a hepatotoxicity experiment, a heat map of the results allows you to quickly determine which compounds are toxic. Red wells are the most confluent and blue wells are the least, showing highest toxicity in rows E-H and empty wells in rows A, M–P.
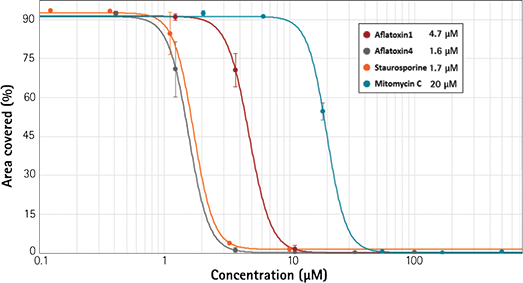
Figure 3. Compound IC50 values determined from curve-fit. IIC50 values for four different compounds were determined using the curve fit function of SoftMax Pro Software.
Neurons
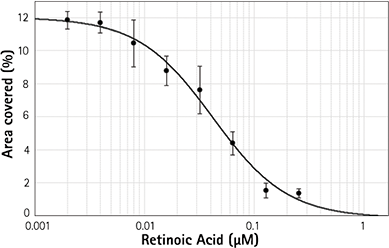
Toxicity in neurons can manifest in reduced number or stunted length of neurite outgrowths even without affecting cell numbers or viability. Imaging assays can provide this additional information by detecting not only cell bodies, but also axons and dendrites associated with each cell. Human iPSC-derived neurons were plated at 5,000 cells/well in a 384-well microplate. A compound, retinoic acid, was tested at 1:2 dilutions in quadruplicate wells using and grown for five days before 24 hour treatment with 1:2 dilutions of a compound, retinoic acid, in quadruplicate wells. Cells were fixed at the end of the treatment and stained with ß-tubulin antibody directly labeled with AlexaFluor 488. Over 2,000 cells can be visualized in one field-of-view covering approximately 30% of the well. Cells were analyzed using the Cell Count Protocol in SoftMax Pro Software (Figure 4).
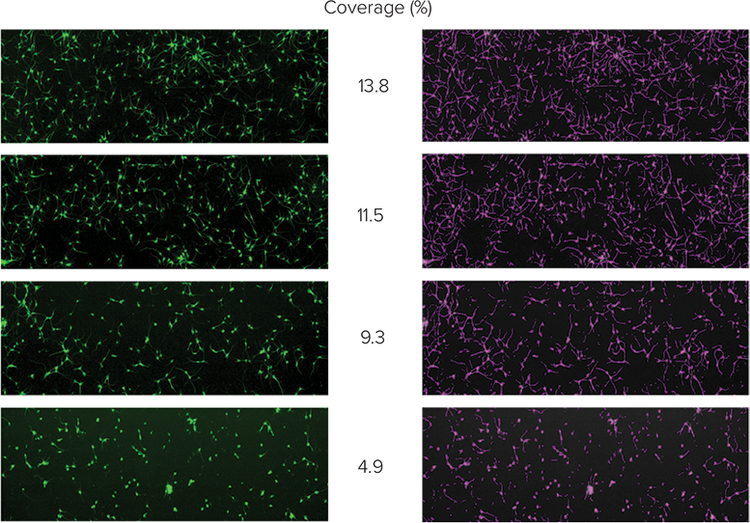
Figure 4. Retinoic acid causes dose-dependent inhibition of neurite outgrowth. Top: As concentration of retinoic acid increases (top to bottom; top row = control), amount of neurite outgrowths decreases. The purple mask (right column) identifies cell bodies and outgrowths.
Right: Plot of the masked area as a function of retinoic acid concentration.Software.
More information from your toxicity assays
The SpectraMax MiniMax Imaging Cytometer provides visualization and morphological information that complements intensity readings on a plate reader. Additional parameters such as cell count and cell density are valuable in determining compound toxic effects using iPSC-derived hepatocytes or neurons.
Learn more about SpectraMax i3x >>