
Application Note
Evaluate cell migration with FluoroBlok inserts on the SpectraMax MiniMax cytometer
- Acquire high-quality images of migrating cells nondestructively
- Obtain accurate data by directly counting cells
- Identify cells quickly with SoftMax Pro Software’s point and click tool
Cathy Olsen, PhD and Hoang Ha | Applications Scientists | Molecular Devices
Introduction
Cell migration, broadly defined as the movement of cells from one location to another, is important in diverse processes including embryonic development and wound healing. It is also a key parameter in metastasis, the spread of cancer cells to different parts of the body from their original location, which encompasses tumor cell invasion, entry into the vasculature, and distal site colonization1 . In vitro, cells migrate in response to chemical signals such as nutrients, and this chemoattraction can be used to study cellular migration mechanisms. Through understanding of the mechanisms of cancer cell migration, novel therapeutics can be developed to impede metastasis in cancer patients.
Corning’s patented FluoroBlok™ inserts allow researchers to measure cellular migration or invasion through a polyethylene terephthalate (PET) membrane separating a suspension of cells from an underlying solution containing chemoattractant. The PET membrane blocks the transmission of light between 400 and 700 nm. Fluorescently labeled cells migrate through 8.0-micron pores in the membrane to reach the chemoattractant, and these cells are readily detected by bottom-read microplate readers or imaging systems (Figure 1). Migrating cells remain viable during the assay, enabling both endpoint and time course assays.
Raw fluorescence read from the bottom of the plate can be used to measure cell migration using the FluoroBlok inserts, but there are limitations to this method. A standard curve of cells is required to standardize the RFU measurements, and variations in fluorescent cell labeling, background fluorescence, and other conditions may adversely affect data quality. By directly counting the cells, researchers obtain accurate cell migration data.
Here, we demonstrate how the SpectraMax® i3x Multi-Mode Microplate Reader with the SpectraMax® MiniMax™ 300 Imaging Cytometer is used to measure cellular migration with FluoroBlok inserts and counting of imaged cells.
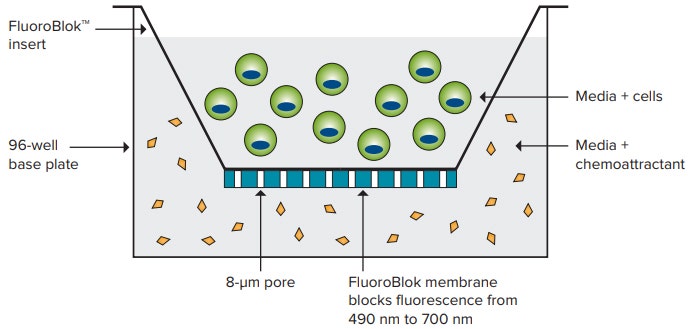
Figure 1. FluoroBlok technology. Fluorescently labeled cells are seeded within FluoroBlok inserts, migrate through 8-µm pores, and are detected from the bottom.
Materials
- FluoroBlok HTS 96 Well Multiwell Permeable Support System with 8.0µm High Density PET Membrane (Corning cat. #351163)
- SpectraMax i3x Multi-Mode Microplate Reader (Molecular Devices cat. #i3x)
- SpectraMax MiniMax 300 Imaging Cytometer (Molecular Devices cat. #5024062)
- NIH3T3 cells (ATCC cat. #CRL-1658)
- Minimum Essential Medium(MEM, Corning cat. #10-010)
- Fetal Bovine Serum (FBS,Gemini Bio-Products cat. #100-106)
- 0.05% Trypsin EDTA (Corning cat. #25-051-CI)
- EarlyTox Live Cell Assay Kit (Molecular Devices cat. #R8342)
Endpoint
Emission = 520 nm
541 exposure: 10 ms
541 focus adjustment: 240 µm
Analysis type: Discrete Object
Wavelength for finding objects: 541
Table 1. Acquisition and analysis settings
Methods
NIH3T3 cells were cultured in MEM with 10% FBS (complete MEM). Cells were trypsinized and resuspended in serumfree media, then stained with 4 µM calcein AM from the EarlyTox™ Live Cell Assay Kit. After staining, cells were pipetted onto FluoroBlok inserts at 20k cells per well. Media containing FBS was used as the chemoattractant for cell migration, and serum-free media was used as a negative control.
A custom plate setting was created in SoftMax Pro Software to accommodate the dimensions of the FluoroBlok inserts. From the Plate Type window within Settings, Edit Plate was selected, and dimensions were modified according to plate dimensions supplied by Corning. The revised plate definition was saved under a new name. This custom plate setting could then be used for future FluoroBlok experiments.
The MiniMax cytometer was used to acquire images of NIH3T3 cells migrating through the PET membrane. Images were acquired at several time points over the course of 20 hours using the acquisition settings listed in Table 1. The reader’s internal temperature was set to 37°C to maximize cell health during reads.
Migrating NIH3T3 cells were identified and quantified using SoftMax Pro Software. Discrete Object Analysis was selected as the analysis type within the Image Analysis Settings. A custom setting was created in the software by identifying cells based on their fluorescent intensity and size (Figure 2). By clicking 4 to 6 representative cells, thresholds were automatically set, and cells were identified by the software. Migrating cell numbers were graphed using the software.
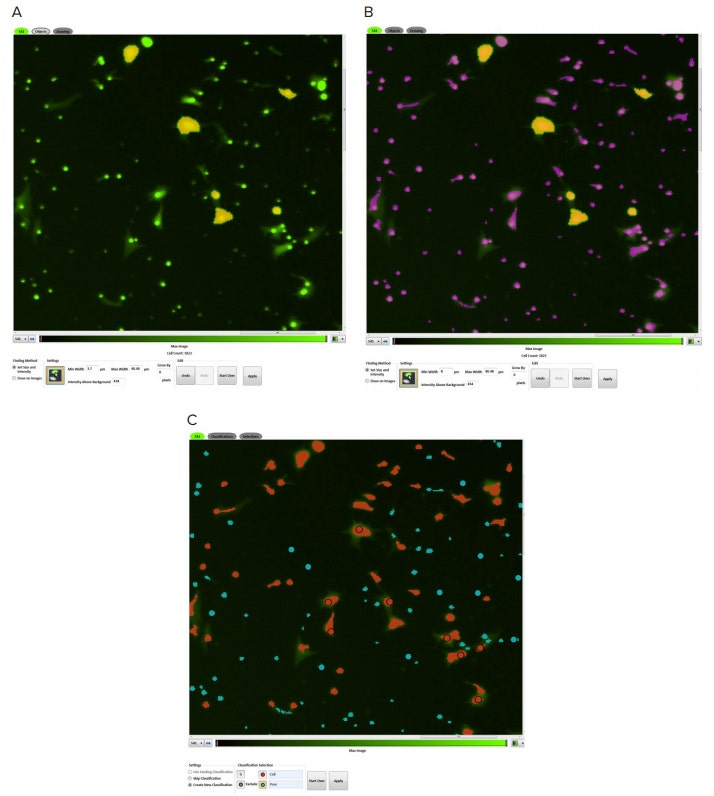
Figure 2. Object identification. NIH3T3 cells were identified by using the point and click feature in SoftMax Pro Software’s acquisition editor. In Figure A, users can set fluorescent size and intensity by clicking on known cells (marked in yellow). Objects identified by the software are marked purple (B). Using the classification tool, users can distinguish cells (red masks) from the smaller pores (blue masks) (C).
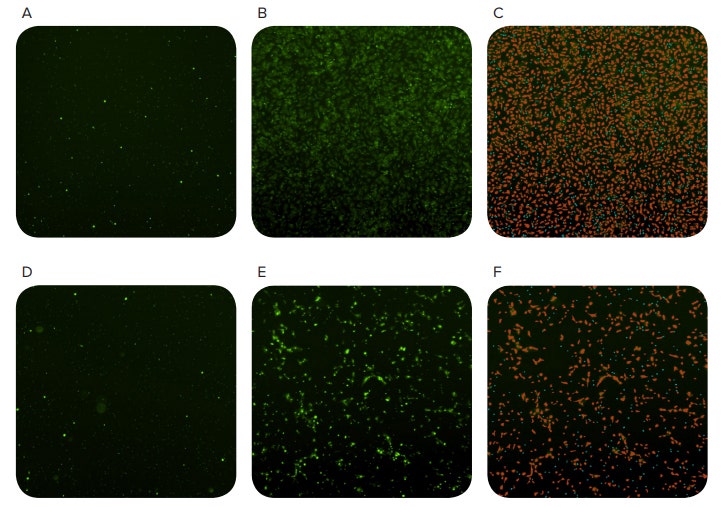
Figure 3. Tracking cell migration using the MiniMax cytometer. Images acquired 0 hours after seeding cells (A and D), 20 hours after seeding (B and E), and objects identified by the software (C and F). The red masks in C and F indicate objects classified as cells and the blue masks indicate small objects classified as pores in the FluoroBlok membrane. The top row shows wells containing chemoattractant and the bottom row shows wells without chemoattractant (negative control)
Results
Fluorescently stained cells were identified as they migrated through the FluoroBlok plate using the MiniMax cytometer and SoftMax Pro Software (Figure 3). Although there was some migration in wells containing no chemoattractant, there was a nearly 3-fold increase in cellular migration in the presence of chemoattractant after 20 hours (Figure 4).
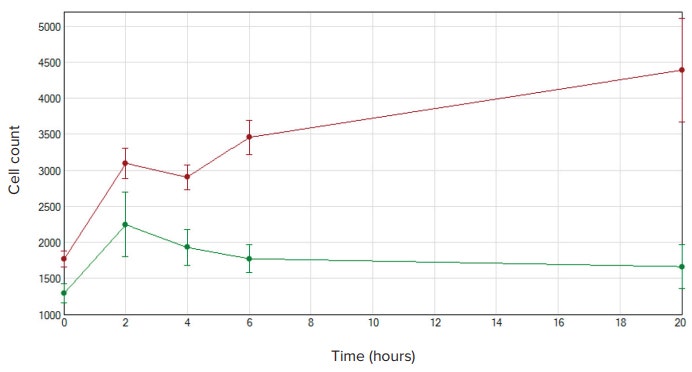
Figure 4. Cell migration cell counts. NIH3T3 cell counts were graphed using SoftMax Pro Software. Wells containing chemoattractant are shown in red and negative control wells are shown in green. Initially both conditions show migration in the first two hours, but cell counts in the wells containing chemoattractant continue to increase over time.
Conclusion
The SpectraMax i3x reader and MiniMax cytometer can be used with FluoroBlok cell culture inserts to directly count cells from high-quality images to measure cellular migration over time. SoftMax Pro Software enables users to quickly set up analysis of cell counts via a simple point and click user interface. Image analysis provides accurate data compared to raw fluorescence, which is subject to cellular staining levels and background fluorescence. Using the image acquisition and analysis features of SoftMax Pro Software in combination with the 96-well FluoroBlok format, researchers can rapidly assess a wealth of cellular migration data to advance their studies in cancer and many other areas of biology.
Reference
1. Chambers, Ann F., Alan C. Groom, and Ian C. MacDonald. Metastasis: dissemination and growth of cancer cells in metastatic sites. Nature Reviews Cancer 2.8 (2002): 563.