
Application Note
Measuring neurite outgrowth with the SpectraMax MiniMax cytometer and MetaMorph software
- Acquire high-quality neuronal images using the SpectraMax MiniMax cytometer
- Accelerate time to results using MetaMorph software’s automated image processing and analysis tools
- Automatically generate detailed neurite outgrowth data such as number of processes, process length, and total measured outgrowth
Introduction
Neurons create connections via extensions of their cellular body called dendrites or “processes”. This biological phenomena is referred to as neurite outgrowth and is regulated by complex intracellular signaling events1. Understanding the signaling mechanisms driving neurite outgrowth provides valuable insight for interpreting neurotoxic compound screening data and for elucidating factors influencing neural regeneration.
Neurite outgrowthis assessed by the segmentation and quantification of neuronal processes2. These neuronal processes can be imaged using a fluorescence microscope and quantified with manual tracing and counting when throughput is low. However, for samples in a higher-throughput microplate format, an automated imaging system paired with analysis software is a more efficient solution.
Here, we demonstrate the benefits of using the SpectraMax®i3x Multi-Mode Microplate Reader with the SpectraMax®MiniMax™ 300 Imaging Cytometer in combination with MetaMorph®Microscopy Automation and Image Analysis Software for performing automated neurite outgrowth imaging and analysis. Specifically, we present neurite outgrowth data from mouse embryonic dorsal root ganglion cells donated by Thong C. Ma, Ph.D. and Dianna E. Willis Ph.D. of the Burke Medical Research Institute, an affiliate of Weill Cornell Medicine.
Materials
- SpectraMax i3xMulti-Mode Microplate Reader (Molecular Devices cat. #i3x)
- SpectraMax MiniMax 300 Imaging Cytometer(Molecular Devices cat. #5024062)
- MetaMorph Microscopy Automation and Image Analysis Software (Molecular Devices cat. #5042477)
- Neurite OutgrowthApplication Module (Molecular Devices cat. #40154)
- CHO-K1 cells (ATCC cat. #CCL-61)
- Recombinant Nerve Growth Factor (EMD Millipore cat. #GF307)
- Anti-ßIII-tubulin antibody (Abcam cat. #52623)
- 5-fluorodeoxyuridine (Sigma cat. #F3503-5MG)
- Neurobasal ® Medium (ThermoFisher cat. #21103049)
- B27 ® Supplement (ThermoFisher cat. #17504044)
Methods
Mouse embryonic dorsal root ganglion neurons were isolated from E12.5 embryos and initially cultured in Neurobasal Medium supplemented with B27 Supplement, 50 ng/mL nerve growth factor (NGF), and 10 μM 5-fluorodeoxyuridine for seven days. The 5-fluorodeoxyuridine was used to kill off any Schwann cells. The dorsal root ganglion cells were then removed from the plate, dissociated, and cultured on a monolayer of control CHO cells.
After 24 hours, the co-cultures were fixed with 4% paraformaldehyde. The cells were then processed for fluorescence immunocytochemistry with an anti-ßIII-tubulin antibody (1:500, rabbit monoclonal) and a green-fluorescent secondary antibody (anti-rabbit). Afterwards, cell cultures were imaged using the MiniMax cytometer using the settings shown in Table 1.
541 exposure: 150 ms
541 focus adjustment: 50 µm
Table 1. MiniMax cytometer Image Acquisition settings.
Acquired images were imported into MetaMorph software. Images from each section of the well were loaded into a stack and stitched together into a montage using the software’s image processing features. These image montages were then used for subsequent neurite outgrowth analysis.
MetaMorph software’s Neurite Outgrowthimage analysis module was used to identify and measure neurite outgrowth based on the settings shown in Figure 1. The software automatically calculates and reports measurements such as number of processes and process length. The measurements were then exported into Microsoft Excel for further analysis and visualization.
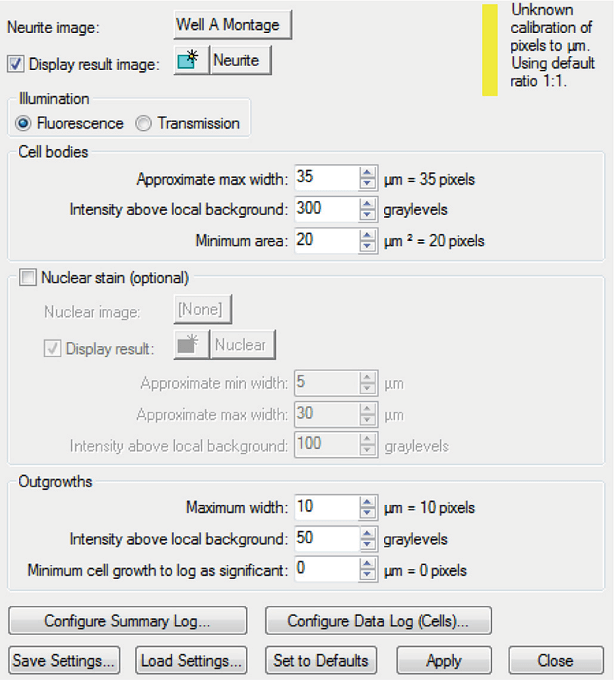
Figure 1. Neurite Outgrowth module settings. These settings were used to select for the size and intensity of the neurons and their processes.
Results
High-quality images of GFP-expressing neurons and their outgrowths were acquired with the MiniMax cytometer (Figure 2). MetaMorph software’s built-in stitching feature was used to create the image montages from the original data generated in SoftMax® Pro Software (Figure 3). Using MetaMorph software’s Neurite Outgrowth module, cell bodies and their outgrowths were identified, and measurements and analysis were reported automatically (Figure 4). Individual neurons could be selected and their neurite outgrowth measurements displayed (Figure 5).
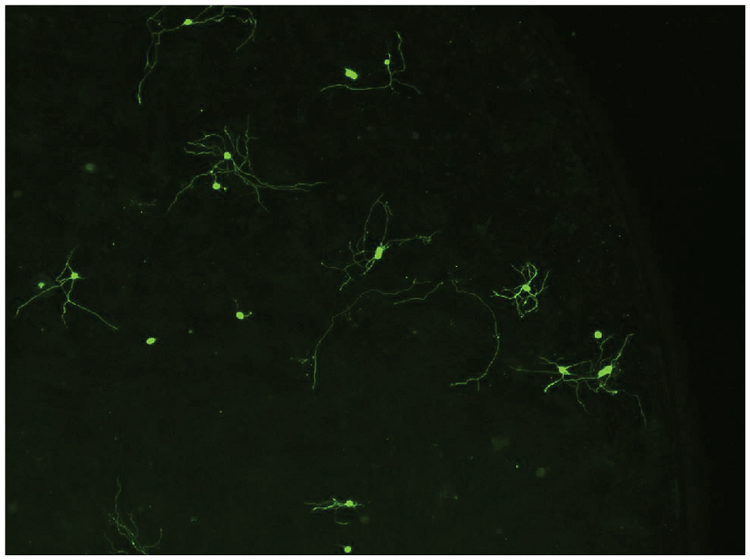
Figure 2. Neuronal cell image. Neurons were imaged using the MiniMax cytometer’s green fluorescence channel. This image represents one of twelve sites imaged in the well.
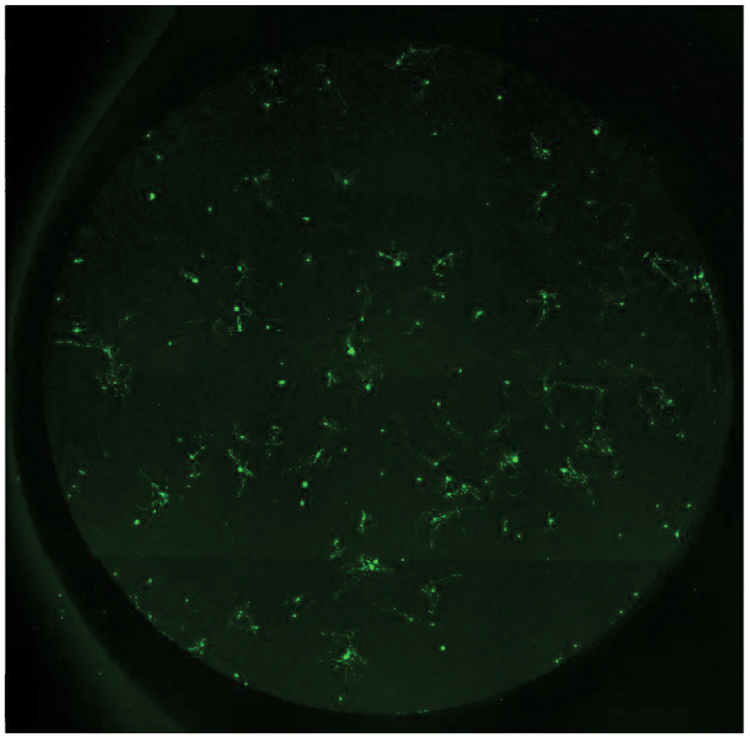
Figure 3. Neuron image montage. Raw images were acquired using the MiniMax cytometer and stitched together using MetaMorph software. This image montage was then used for neurite outgrowth analysis.
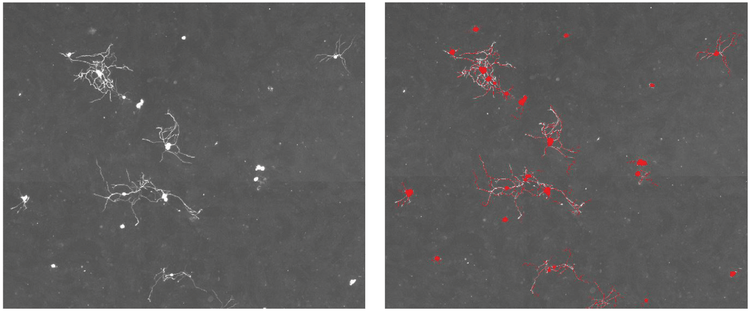
*Figure 4. MetaMorph software object overlay. The MetaMorph software’s neurite outgrowth module used the grayscaled neuronal image montage **(left)*to identify neuronal cell bodies and their processes, which are indicated by a red image overlay (right).
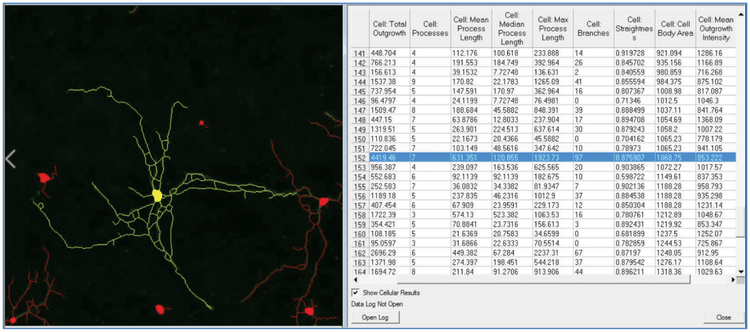
***Figure 5. Neurite processes measurements.*MetaMorph software automatically calculates a variety of neurite outgrowth measurements. Each identified neuron has a number associated with it. Here, a specific neuron is selected (yellow overlay) and its associated measurements are highlighted (blue in the table).
Data were exported into Excel for additional analysis. In this example, we explored the relationship between the number of processes and total outgrowth (total area covered by outgrowth, measured in pixels) (Figure 6). This is just one example of data analysis that can be performed; other types include comparing neuronal populations or between individual neurons.
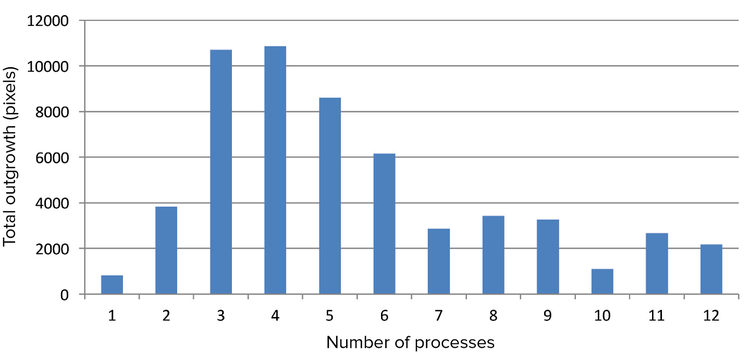
Figure 6. Relationship between total neurite outgrowth and number of processes. Neurons were sorted based on their number of processes, and each group’s total outgrowth was averaged. The relationship between number of processes and total outgrowth was displayed as a bar graph using Microsoft Excel. The graph seems to indicate that the total outgrowth is maximized at around three or four processes with total outgrowth decreasing with increased processes.
Conclusion
When used together, the MiniMax cytometer and MetaMorph software allow researchers to image neurons and acquire detailed information about neurite outgrowth. The MiniMax cytometer images fluorescently stained neurons with great clarity, while MetaMorph software’s suite of image processing and analysis tools enable detailed and quantitative analysis of neurite outgrowth. These two products provide a total solution for researchers to elucidate the mechanisms behind neuron differentiation and regeneration and interpret neurotoxic screening results.
References
- Kiryushko, Darya, Vladimir Berezin, and Elisabeth Bock. “Regulators of neurite outgrowth: role of cell adhesion molecules.” Annals of the New York Academy of Sciences 1014.1 (2004): 140-154.
- Meijering, E., et al. “Design and validation of a tool for neurite tracing and analysis in fluorescence microscopy images.” Cytometry Part A 58.2 (2004): 167-176.
前言
神经细胞通过延展他们的身体彼此间产生 连接,叫做树突(dendrites or processes)。 这种生理现象与神经生长有关,并且和复 杂的细胞内信号传导有关。理解突触生长 的信号通路机理有助于神经毒性化合物的 筛选,阐明影响神经再生的因素。
突触生长的测量是要将神经突触进行分割 及量化,在样品量少的时候,突触的计算 需要用荧光试剂标记后用显微镜拍照,再 手动的画出及计数。然而,当样品量大的 时候,就需要自动的成像和分析系统来提 高效率。
本篇应用说明将介绍应用SpectraMax® i3x 多功能微孔板检测平台配置SpectraMax® MiniMax™ 300细胞成像系统在神经突触成 像和分析上的优势。特别指出,我们引用 的小鼠胚胎背部根神经节细胞突触数据是 由康奈尔大学医学院附属伯克医疗研究所 的Thong C. Ma博士。
材料
- SpectraMax®i3x多功能微孔板检测平台 (Molecular Devices cat. #i3x)
- SpectraMax® MiniMax™ 300细胞成像系 统(Molecular Devices cat. #5024062)
- MetaMorph图像分析软件 (Molecular Devices cat. #5042477)
- 神经突触分析模块 (Molecular Devices cat. #40154)
- CHO-K1 细胞 (ATCC cat. #CCL-61)
- 重组神经生长因子 (EMD Millipore cat. #GF307)
- Anti-ßIII-tubulin抗体 (Abcam cat. #52623)
- 5-fluorodeoxyuridine (Sigma cat. #F3503-5MG)
- Neurobasal® 培养基 (ThermoFisher cat. #21103049)
- B27® 补充剂 (ThermoFisher cat. #17504044)
方法
小鼠胚胎背部根神经节细胞从E12.5胚胎 分离出来,并培养在加入B27补充剂、 50ng/mL神经生长因子(NGF)10 μM 5-fluorodeoxyuridine的Neurobasal培养 基中。5-fluorodeoxyuridine是为了杀死 许旺细胞。培养几天后,将背部根神经节 细胞消化,移至孔板中,并培养在单层贴 壁的CHO细胞上。
24小时共培养后用4%多聚甲醛固定,并 将细胞进行免疫荧光染色,一抗为 Anti-ßIII-tubulin抗体(1:500稀释,兔单 抗),二抗为绿色荧光二抗。此后,用 MiniMax细胞成像系统对细胞进行成像, 设置参数如表1所示。
541 exposure: 150 ms
541 focus adjustment: 50 µm
表1 MiniMax细胞成像系统成像设置参数
拍摄的图片导入MetaMorph软件,每孔中 的不同视野的多张图像被生成一个stack 文件,并用拼接功能生成一张大图,这张 大图将用来分析神经突触。
MetaMorph的神经突触分析模块可用于突 触测量,模块设置参数如图1所示。软件 可自动识别、计算并导出参数,如突触个 数、突触成度等。这些参数导出到Excel 中,可用于后期的分析及作图。
图1 神经突触分析模块参数设置。 设置参数为神经元和突触的大小和荧光强度。
结果
GFP表达的神经元及其突触用MiniMax细 胞成像系统可拍出高质量图像(图2)。 SoftMax Pro软件得到的原始数据经过 MetaMorph内置的拼接功能可得到整孔的 拼接大图(图3)。在应用MetaMorph的神 经突触分析模块自动的识别、计算神经细 胞胞体和突触,并将得到的参数导出(图 4)。每个神经元的参数都可选出并单独列 出(图5)。
图2 神经细胞图像。 应用MiniMax细胞成像系统的绿色荧光通道拍摄神经细胞图像,图中所示为一个 孔的12个视野之一。
图3 神经细胞的拼接图。 MiniMax细胞成像系统拍摄的原始图被MetaMorph软件拼接成整孔的大图。 这种大图将被用于神经突触的分析。
图4 MetaMorph软件识别图。 MetaMorph软件的神经突触分析模块对拼接图的灰度图(左)进行识别神 经元胞体和突触,识别到的位置用红色蒙版标出(右)。
***图5 神经突触参数。*MetaMorph软件可自动计算出多种神经突触生长的参数,并可显示出每个被识别 的神经元及其突触。图中黄色部分为一个神经元细胞,与其相关的突触被高亮显示(表中蓝色)
数据被导出到Excel中进行进一步分析。 在此实例中,我们研究了分支数和突触总 面积直接的关系(图6)。这只是能够分析的 实验例子之一,其他的还包括比较突触个 数或比较不同神经元之间的差异。
图6 突触总面积与分支数的关系。 神经元细胞以分支数量分类,每一组中的突触总面积为平均值。突 触总面积与分支数的关系用Excel的柱状图展示,由图标可得随着分支数的增加,突触总面积先增加 后减少,最大值出现在分支数为3和4的时候。
结论
将MiniMax细胞成像系统和MetaMorph软 件联合使用,可以拍摄神经元图片,并得 到具体的神经突触参数。MiniMax细胞成 像系统可拍摄出清晰的荧光染色神经细 胞,MetaMorph软件的图像处理功能及分 析模块可以准确的分析得到神经突触生长 相关的所以参数。两种产品联合使用给科 学工作者提供了一个研究神经生长和分 化,及神经毒性筛选的完全解决方案。
参考文献
- Kiryushko, Darya, Vladimir Berezin, and Elisabeth Bock. “Regulators of neurite outgrowth: role of cell adhesion molecules.” Annals of the New York Academy of Sciences 1014.1 (2004): 140-154.
- Meijering, E., et al. “Design and validation of a tool for neurite tracing and analysis in fluorescence microscopy images.” Cytometry Part A 58.2 (2004): 167-176.