
Application Note
Assessment of neurotoxicity and neuronal development using induced pluripotent stem cell-based neurite outgrowth assay
- Identify neurotoxic effects using iPSC-derived neurons
- Quantify complex neurite networks using multi-parameter image analysis
- Evaluate and prioritize chemicals for their neurotoxicity potential
Oksana Sirenko, PhD| Sr. Research Scientist | Molecular Devices | Sunnyvale, CA
Introduction
Growing concerns about the increased prevalence of untested chemicals in the environment has created a pressing need to develop reliable and efficient screening tools to identify chemicals that could potentially affect human health1, particularly in neurological development.
We evaluated a neurite outgrowth assay as a possible screen to characterize the activity of selected compounds with the potential to adversely affect the developing nervous system. This assay was selected due to its relevance as a model of a critical process in nervous system development in which neurons extend their neurites to form a complete neural network2. Disruption of this process can lead to adverse effects in humans and rodents whereby studies suggest that immature, developing, and mature neurites are targets of chemical toxicity3.
While predominantly used to assess developmental neurotoxicity, the neurite outgrowth assay can also be used to evaluate neurodegeneration as measured by neurite retraction. Furthermore, this assay might be relevant for evaluation of neuroplasticity in adult neurons4. For screening assays, total neurite outgrowth is typically the most common metric reported1,5. Utilizing automated imaging enables multi-parametric evaluation of additional features, such as the number of total branches and total processes to encompass different modes by which compounds may inhibit neurite outgrowth6,7.
Materials
- ImageXpress® Nano Automated Imaging System with CellReporterXpress® software (Molecular Devices)
- iCell ® Neurons (Cellular Dynamics International)
- Poly-d-lysine pre-coated 384-well plate (Corning Life Sciences)
- Laminin (Sigma-Aldrich)
- Paraformaldehyde (Sigma-Aldrich)
- Fetal Bovine Serum (Sigma-Aldrich)
- Beta-tubulin III (TUJ-1) (BD Biosciences)
- Hoescht (ThermoFisher Scientific)
- Anti-ß-tubulin antibodies (BD Biosciences)
- Calcein AM (ThermoFisher Scientifiic)
Identification of neurotoxic compounds using an iPSC-based neurite outgrowth assay
Previously characterized human iPSC-derived neurons (i.e. iCell Neurons), consisting of a mixture of post-mitotic GABAergic and glutamatergic neurons, and supporting media were provided by Cellular Dynamics International (CDI). Neurons used in these studies were provided by the manufacturer as a fully differentiated and purified population of cells that formed neurite networks positive for the neuronal markers beta-III tubulin and MAP28. Cells were received frozen and were subsequently thawed and plated according to a protocol recommended by CDI. Cells were plated on poly-d-lysine, pre-coated 384-well plates and treated with 3.3 μg/mL laminin. Prior to compound treatment, 7,500 cells were plated per well and were maintained in iCell Neurons Maintenance Medium for 48h. Neurite networks in these cells typically start to form \~24h post plating and increase in complexity up to 10–12 days in culture. At 48h post plating, we assessed neurite outgrowth, however, neurite retraction may have also occurred concomitantly. Compounds were tested in duplicates across a 6-point concentration range (0.3, 1.0, 3.0, 10.0, 30.0, and 100 μM). Multiple DMSO controls (n=16) and untreated controls (n=16) were included in each plate. Up to 0.3% DMSO was used to assess solvent effects within the assay. Cells were exposed to compounds for 72h at 37°C and 5% CO2.
Next, media was removed and cells were fixed with 4% paraformaldehyde for 2h. This was followed by permeabilization with 0.01% saponin in PBS with 1% Fetal Bovine Serum. Then, the cells were incubated with AF488-conjugated mouse anti-human antibodies against beta-tubulin III (TUJ-1) (1:100 dilution) and 2 μg/mL Hoechst for 3h. Beta-tubulin was used as a marker for neurite outgrowth and also for counts of the intact neuronal cell bodies. After incubation, the staining solution was replaced with phosphate buffered saline (PBS). Alternatively, the neurotoxicity assay can be done using live cells, stained for 30 min with Calcein AM and Hoechst dyes (0.5 μM and 2 μM respectively). Details regarding optimization of plating density and the protocol for the 384-well format assay are described in detail in Sirenko et al.6.
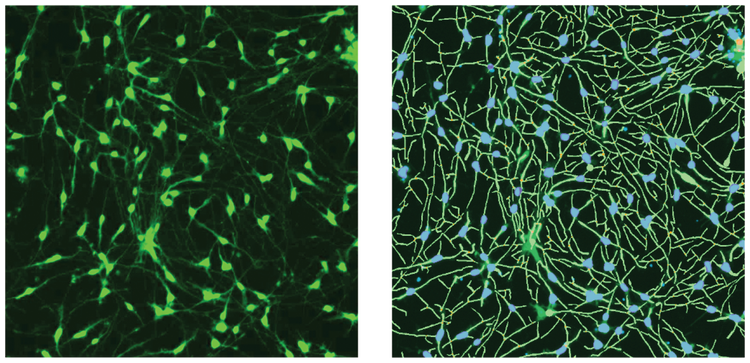
***Figure 1. Images of ß-tubulin (green) stain and the software analysis traces shown for the control cells.*iCell Neurons were plated for five days, then fixed and stained with AF488-conjugated anti-ß-tubulin (TUJ-1) antibodies (1:100). Images were taken by the ImageXpress Nano system using a 10X Plan Fluor objective and FITC channel. Images were processed using the Neurite Tracing analysis algorithm in CellReporterXpress software. Analysis masks on the right show the outgrowth (green) and cell bodies (blue).
Images from individual wells were acquired with the ImageXpress Nano Automated Imaging System using a 10X Plan Fluor objective. One 10X image was captured at a single site per well in a 384-well plate. The 10X objective provided sufficient resolution to distinguish neurite networks and sub-cellular structures in a relatively large number of cells (500–1,000) per image, which represented about 1/4 of the total well area. Following image capture, all image analysis was accomplished using the CellReporterXpress Software, which contained image processing application modules for neurite outgrowth and viability assessment. As an example of image processing, Figure 1 shows zoomed in representative images from neurite images and corresponding analysis masks. Figure 2 shows images from DMSO-treated neurons and compound treated neurons with software tracing overlays.
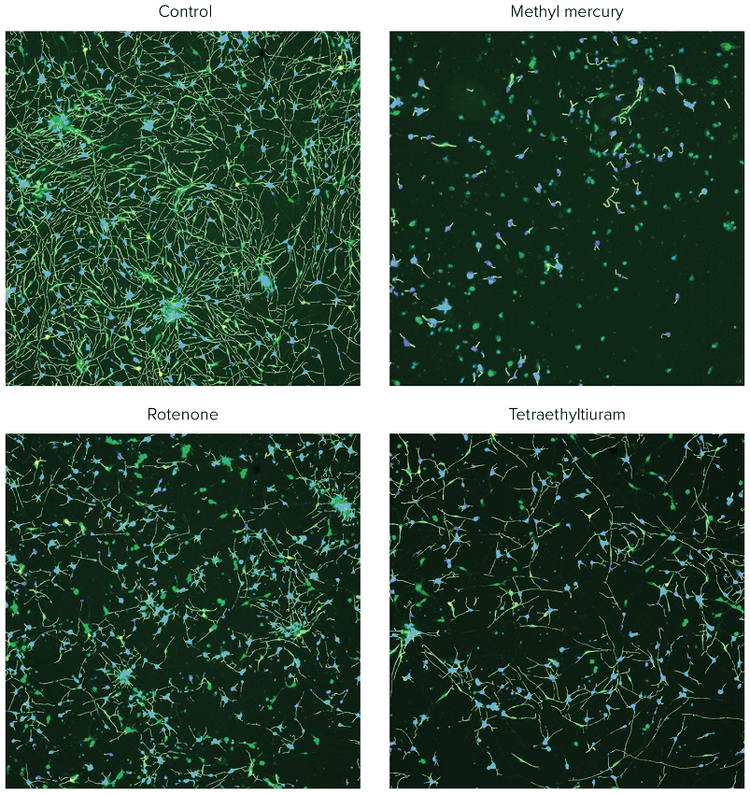
***Figure 2. Composite images of ß-tubulin (green) and Hoechst (blue), with the analysis traces shown for the control cells and the cells treated with selected compounds.*iCell Neurons were plated for 48h, treated with compounds for 72h, and then fixed and stained with a combination of Hoechst (2 μM) and AF488-conjugated anti-TUJ-1 antibodies (1:100). Images were taken by the ImageXpress Nano system using a 10X Plan Fluor objective and DAPI and FITC channels. Images were processed using the Neurite Tracing analysis algorithm in CellReporterXpress software. Disruption of neurite networks and cell death was observed for neurons treated with indicated compounds.
Quantifying the complexity of neurite networks using multi-parameter image analysis
We observed a dose-dependent inhibition of neuronal network formation due to compound treatment effects (Figure 3). Quantitative analysis of the images captured in these experiments included the derivation of multiple parameters allowing for the assessment of both the morphological features of cultured neurons, and the extent and degree of complexity of the neuronal networks. Specifically, neurite outgrowth was characterized by the extent of the outgrowth (e.g. length of total outgrowth or mean outgrowth per cell), the number of neurite processes (e.g. total number of processes and mean number of processes per cell), and the extent of branching (e.g. total number of branches and mean number of branches per cell). Cell plating and neurite outgrowth were uniform across the experiment, so we used total numbers of features (branches and processes) per image for statistical analysis. In addition, the number of ß-tubulin (TUJ-1 positive), or Calcein AM positive cell bodies in each image was quantitated to assess compound-induced cell death. The length of outgrowth per cell and the numbers of processes and branches per individual cell were also measured but were not used for statistical analysis due to redundancy.
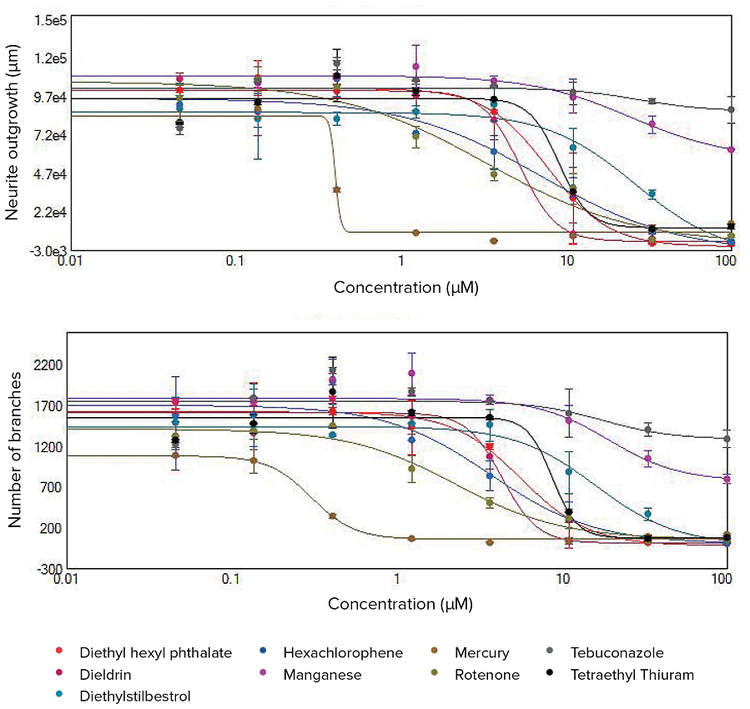
***Figure 3. Concentration response curves for total neurite outgrowth lengths and total numbers of branches.*Disruption of neurite networks and cell death observed after compound treatments were quantitated using the Neurite Outgrowth analysis algorithm in CellReporterXpress software. Dose-dependent effects are indicated by decreased total outgrowth lengths and numbers of branches. The 4-parameter curve fit is shown here for the selected compounds using these two readouts. EC50values are included in Table 1.
The toxic effects of compounds can be compared by EC50values (concentration of compound for 50% inhibition of neurite outgrowth). EC50values were derived from the 4-parametric curve fits by the values for neurite outgrowth, number of branches, number of processes, and number of viable cell bodies. Figure 3 shows concentration dependent curves for the total length of neurite networks (total outgrowth) and total numbers of branches. These measurements allowed us to define effective toxic concentrations, compare compounds for their potential neurotoxic effects, and prioritize for further toxicity evaluation.
Evaluating dose-response for multiple parameters
The concentration response curves were evaluated using the Hill model to derive EC50concentration values. The EC50values for different readouts are presented in Table 1. Among the 16 tested compounds, treatment with 11 of these resulted in decreased neurite outgrowths as well as reduced numbers of branches and processes. Of these 11 compounds, treatment with six of these also resulted in a decreased number of cell bodies. The other five tested compounds had a relatively minor effect, therefore EC50values were not determined. The EC50values for inhibition of total branches and total outgrowth endpoints exhibited high concordance. The disruption of neuronal networks was evident at lower concentrations versus the cytotoxicity effect for selected treatments. Therefore, the EC50values measured for the decrease in the number of cell bodies were typically higher than EC50values for inhibition of neurite outgrowth due to treatment with these compounds.
* EC50values (in µM) measured for tested compounds using the length of total neurite outgrowth and number of branches as readout. Error limits are Standard Error of the parameter estimate defined from the curve fit. ** The undefined standard errors for some parameters indicate that although the curve fits have converged, the uncertainty in the parameter estimates could not be determined. *** “>100” means toxic effects (decrease of neurite outgrowth, numbers of branches, etc.) were observed at the highest concentration tested (100 µM), but EC50values were not determined. **** “No effect” means no apparent effects were observed at the highest concentrations tested (100 µM). ***Table 1. EC50values for neurotoxic effects measured for tested compounds using different readouts.*Concentration response curves were calculated for total neurite outgrowth, total branches, total processes, and total cell bodies. EC50values were derived from the 4-parameter curve fits for each compound treatment using the Hill model.
Conclusion
The neurite outgrowth assay is an efficient and effective high-throughput screening experiment suitable for evaluation of neurotoxicity across large libraries of chemical compounds. This screen allows for rapid identification, evaluation, and prioritization of compounds for their potential to induce neurotoxicity in humans. This assay can also be used to evaluate compounds that may have a neuroprotective or stimulative effect on neuronal development. The ImageXpress Nano system is an efficient tool for performing advanced phenotypic assays suitable for a high-throughput screening campaign.
References
- Radio, N.M., Breier, J.M., Reif, D.M., Judson, R.S., Martin, M., Houck, K.A., et al., 2015. Use of neural models of proliferation and neurite outgrowth to screen environmental chemicals in the ToxCast Phase 1 library. Appl. *In Vitro Toxicol.*1 (2), 131–139.
- Harrill, J.A., Robinette, B.L., Freudenrich, T., Mundy, W.R., 2013. Use of high content image analyses to detect chemicalmediated effects on neurite sub-populations in primary rat cortical neurons. Neurotoxicology 34, 61–73.
- Radio, N.M., Mundy, W.R., 2008. Developmental neurotoxicity testing in vitro: models for assessing chemical effects on neurite outgrowth. Neurotoxicology 29, 361–376.
- Lee W-CA, Huang H, Feng G, Sanes JR, Brown EN, So PT, et al. 2006. Dynamic remodeling of dendritic arbors in GABAergic interneurons of adult visual cortex. *PLoS Biol.*4(2): e29.
- Stiegler, N.V., Krug, A.K., Matt, F., Leist, M., 2011. Assessment of chemical-induced impairment of human neurite outgrowth by multiparametric live cell imaging in high-density cultures. *Toxicol. Sci.*121, 73–87.
- Sirenko, O., Hesley, J., Rusyn, I., Cromwell, E.F., 2014. High-content high-throughput assays for characterizing the viability and morphology of human ipsc-derived neuronal cultures. *Assay Drug Dev. Technol.*12, 536–547.
- Ryan, K.R., Sirenko, O., Parham, F., Hsieh, J.H., Cromwell, E.F., Tice, R.R., Behl, M., 2016. Neurite outgrowth in human induced pluripotent stem cell-derived neurons as a high-throughput screen for developmental neurotoxicity or neurotoxicity. *Neurotoxicology.*53: 271-81.
- iCell Neurons | Cellular Dynamics. (n.d.). Retrieved June 01, 2017, from http://www.cellulardynamics.com/products/neurons.html
Oksana Sirenko, PhD| Sr. Research Scientist | Molecular Devices | Sunnyvale, CA
介绍
对环境中未经检验的化学品日益普遍的关注 已经产生了开发可靠和有效的筛选工具以识 别可能影响人类健康的1,特别是神经系统 发育的化学物质的迫切需求。
我们评估了一种神经突向外生长的测定方 法,通过筛选和表征所选化合物的活性,评 估其是否可能对发育中的神经系统产生不利 影响。选择该测定法是因为其在神经系统发 育关键过程的模型具有一定相关性,特别是 神经元会通过延伸其神经突以形成完整的神 经网络2。破坏这一过程可能会对人类和啮 齿动物产生不利影响,因此研究表明,未成 熟、发育中和成熟的神经突是化学毒性的靶 标3 。
虽然神经突向外生长测定主要用于评估发育 神经毒性,但也可用于评估通过检测神经突 收缩的神经变性。此外,该测定还有可能与 评估成年神经元中的神经可塑性相关4。对 于筛选测定,总神经突向外生长通常是指标 报告中最常见的度量标准1,5。利用自动成像 还能够对其他特征进行多参数评估,例如总 分支数和总过程数,以评估化合物可抑制神 经突向外生长的不同方式6,7。
材料
- ImageXpress Nano 自动成像系统,配 备 CellReporterXpress 自动图像采集和 分析软件 (Molecular Devices)
- iCell® 神经元 (Cellular Dynamics International)
- Poly-d-赖氨酸预包被 384 孔板 (Corning Life Sciences)
- 层粘连蛋白 (Sigma- Aldrich)
- 多聚甲醛 (Sigma-Aldrich)
- 胎牛血清 (Sigma-Aldrich)
- β-微管蛋白 III (TUJ-1) (BD Biosciences)
- Hoescht (ThermoFisher Scientific)
- 抗 β-微管蛋白抗体 (BD Biosciences)
- Calcein AM (ThermoFisher Scientifiic)
利用基于 iPS 细胞的神经突生长 测定法鉴定具有神经毒性的化 合物
由国际细胞动力学会 (CDI) 提供的人 iPSC 衍生的神经元 ( 即 iCell 神经元 ) 细胞,是 由有丝分裂后 GABA 活性基团和谷氨酸能 神经元组成的混合物。这些研究中使用的 神经元已经由制造商培养成完全分化和纯 化的细胞群,并已形成对神经元标志物 β-III 微管蛋白和 MAP28 呈阳性的神经突 网络。细胞收到时为冷冻状态,随后解冻 并根据 CDI 推荐的方案铺板。将细胞接种 在聚-d-赖氨酸预包被的 384 孔板上,并用 3.3μg / mL层粘连蛋白进行处理。在化合 物处理之前,每孔接种 7,500 个细胞,并 在 iCell Neurons 培养基中生长 48 小时。 这些细胞中的神经突网络通常在接种后约 24 小时开始形成,并且在培养至 10-12 天 时开始增加复杂性。在接种后 48 小时, 我们神经突向外生长进行评估,与此同 时,神经元也可能发生神经突萎缩。在 6 种浓度范围 ( 0.3,1.0,3.0,10.0,30.0 和 100 μM ) 中一式两份测试化合物。每个平板中 包括多个 DMSO 对照 (n=16) 和未处理的 对照 (n=16)。使用高达 0.3% 的 DMSO 来评估测定中的溶剂效应。将细胞在 37℃ 和 5% CO2 下暴露于化合物下 72 小时。接 着,除去培养基,用 4% 多聚甲醛固定细 胞 2 小时。用含有 1% 胎牛血清和 0.01% 皂苷的 PBS 中的进行透化。随后,将细胞 与抗 β-微管蛋白 III (TUJ -1) 抗体 ( 1:100 稀释 ) 和 2 μg / mL Hoechst 的结合 AF488 染料的小鼠抗人抗体孵育 3 小时。 β-微管 蛋白用作神经突向外生长的标记物,也用 于完整神经元细胞体的计数。温育后,用 磷酸盐缓冲盐水 (PBS) 替换染色溶液。或 者,还可以使用活细胞进行神经毒性测 定,用钙黄绿素 AM 和 Hoechst 染料 ( 分 别为 0.5 μM 和 2 μM ) 染色 30 分钟。有关 接种密度优化的详细信息和 384 孔格式测 定的方案在 Sirenko et al.6 中有详细描 述。
***图 1 ß-微管蛋白 ( 绿色 ) 染色的图像和对照细胞的软件分析轨迹。*将 iCell 神经元铺板培养 5 天,然后 固定,并用 AF 488 结合的抗-β-微管蛋白 (TUJ-1) 抗体 (1:100) 染色。图像由 ImageXpress Nano 系统 使用 10x Plan Fluor 物镜和 FITC 通道拍摄。使用 CellReporterXpress 软件中的 Neurite Tracing 分析 算法处理图像。右侧的分析图层显示细胞生长 ( 绿色 ) 和细胞体 ( 蓝色 )。
使用 ImageXpress Nano 自动成像系统的 10 倍 Plan Fluor 物镜拍摄各孔的图像。在 384 孔板中的每个孔的单个位点捕获一个 10x 图像。10x 物镜提供了足够的分辨率 来区分每个图像中大量细胞 (500-1,000) 的神经突网络和亚细胞结构,能覆盖表总 孔面积的约 1/4。在获取图像之后,使用 CellReporterXpress™ 自动图像采集和分 析软件完成所有图像分析,该软件包含用 于神经突向外生长和活力评估的图像处理 应用模块。作为图像处理的示例,图 1 表 示出了来自神经突图像和相应分析图层的 放大的典型图像。图 2 显示来自 DMSO 处 理的神经元和化合物处理的神经元的图 像,在其相应结构上有软件追踪的覆盖图 层。
***图 2 ß-微管蛋白 ( 绿色 ) 和 Hoechst ( 蓝色 ) 的复合图像,显示对照细胞和用所选化合物处理的细胞 的分析轨迹。*将 iCell 神经元铺板 48 小时,用化合物处理 72 小时,然后固定并用 Hoechst (2 μM) 和 带 AF 488 荧光的抗 TUJ-1 抗体 (1:100) 进行组合染色。图像由 ImageXpress Nano 系统使用 10x Plan Fluor 物镜进行 DAPI 和 FITC 通道拍摄。使用 CellReporterXpress 软件中的 Neurite Tracing 分 析算法处理图像。观察到用指定化合物处理的神经元中破坏的神经突网络和细胞死亡。
使用多参数图像分析对神经元 网络的复杂性进行定量分析
我们观察到由于化合物处理效应导致的神经 元网络形成的剂量依赖性抑制 ( 图 3 )。在这 些实验中获取的图像的定量分析包括多个参 数的测定,以全方位评估培养的神经元的形 态特征,以及神经元网络的复杂程度和生长 程度。具体而言,神经突向外生长的特征在 于生长的程度 ( 例如,总生长的长度或每个 细胞的平均生长长度 ),神经突过程的数量 ( 例如,过程的总数和每个细胞的平均过程 数 ),以及分支的程度。( 例如,分支的总 数和每个单元的平均分支数 )。在整个实验 中,细胞铺板和神经突向外生长均匀,因 此我们可以使用每个图像的特征 ( 分支和 过程 ) 的总数进行统计分析。此外,定量每 个图像中 β-微管蛋白 ( TUJ-1阳性 ) 或钙黄绿 素 AM 阳性细胞体的数量以评估化合物诱导 的细胞死亡。同时还测量了每个细胞的生长
***图 3 由鬼笔环肽染色的活心肌细胞的剂量 - 反应曲线。*通过分析由化合物处理诱导的细胞骨架完整性 的细胞毒性作用来确定细胞活力。使用 CellReporterXpress 软件中的细胞评分分析算法对用于鬼笔环 肽 ( 肌动蛋白染色为绿色 ) 染色阳性的活细胞总数进行定量。用 4 参数曲线拟合绘制浓度依赖性响应曲 线,以获得包括在表 1 中的 EC50 值。
长度以及每个细胞的过程和分支的数量,但 由于信息冗余而未用于统计分析。 化合物的毒性作用可以通过 EC50 值 ( 对神经 突向外生长的抑制程度达到50%时的化合物 浓度 ) 进行比较。EC50 值来自 4 参数曲线拟 合,神经突向外生长、分支数、过程数和活 细胞体数量。图 3 显示了神经突网络总长度 ( 总生长 ) 和分支总数的浓度依赖曲线。这些 测量可以让我们定义有效的毒性浓度,比较 化合物的潜在神经毒性效应,并优先进行进 一步的毒性评估。
评估剂量效应以获取复合参数
使用 Hill 模型评估浓度响应曲线以得 出 EC50 浓度值。表 1 中列出了不同读数 的 EC50 值。在 16 种被测化合物中,其中 11 种进行处理之后导致神经突向外生长减 少以及分支和过程数量减少。在这 11 种 化合物中,其中 6 种化合物的处理也导致 细胞体数量减少。其他 5 种被测化合物具 有相对较小的影响,因此未确定 EC50 值。 抑制总分支数和总生长终点的 EC50 值表现 出高度一致性。在较低浓度下神经网络的 破坏与特定处理条件下的细胞毒性效应相 比差别是显著的。因此,测量细胞体数量 减少的 EC50 值通常高于用这些化合物处理 时抑制神经突向外生长的 EC50 值。
*使用总神经突向外生长长度和分支数量作为读数测量测试化合物的 EC50 值( 以 μM 计 )。误差限制是根 据曲线拟合定义的参数来估计的标准误差。 **某些参数的未定义标准误差表明虽然曲线拟合已重合,但无法确定参数估计中的不确定性。 ***“>100”表示在测试的最高浓度 ( 100 μM ) 下观察到毒性作用 ( 神经突向外生长减少,分枝数量减 少等 ),但未测定 EC50 值。 ****“无效”表示在测试的最高浓度 ( 100 μM ) 下未观察到明显的效果。 ***表 1 使用不同示值读数的测试化合物的神经毒性效应的 EC50 值。*计算总神经突向外生长,总分支,总 过程和总细胞体的浓度响应曲线。EC50 值来自使用Hill模型的每种化合物处理的 4-参数曲线拟合。
结论
神经突向外生长测定是一种有效且高效 的高通量筛选实验方法,适用于评估大 型化学化合物库的神经毒性。这种筛选 能进行化合物的快速鉴定、评估和优先 排序,以评估其在人体中可能诱导的神 经毒性。该测定还可用于评估可能对神 经元发育具有神经保护或促进作用的化合 物。ImageXpress Nano 系统是一种有效 的筛选工具,可用于进行适合于高通量筛 选活动的高级表型分析。
参考文献
- Radio, N.M., Breier, J.M., Reif, D.M., Judson, R.S., Martin, M., Houck, K.A., et al., 2015. Use of neural models of proliferation and neurite outgrowth to screen environmental chemicals in the ToxCast Phase 1 library. Appl. In Vitro Toxicol. 1 (2), 131‒139.
- . Harrill, J.A., Robinette, B.L., Freudenrich, T., Mundy, W.R., 2013. Use of high content image analyses to detect chemical-mediated effects on neurite sub-populations in primary rat cortical neurons. Neurotoxicology 34, 61‒73.
- Radio, N.M., Mundy, W.R., 2008. Developmental neurotoxicity testing in vitro: models for assessing chemical effects on neurite outgrowth. Neurotoxicology 29, 361‒376.
- Lee W-CA, Huang H, Feng G, Sanes JR, Brown EN, So PT, et al. 2006. Dynamic remodeling of dendritic arbors in GABAergic interneurons of adult visual cortex. PLoS Biol. 4(2): e29.
- Stiegler, N.V., Krug, A.K., Matt, F., Leist, M., 2011. Assessment of chemical-induced impairment of human neurite outgrowth by multiparametric live cell imaging in high-density cultures. Toxicol. Sci. 121, 73‒87.
- Sirenko, O., Hesley, J., Rusyn, I., Cromwell, E.F., 2014. High-content high-throughput assays for characterizing the viability and morphology of human ipsc-derived neuronal cultures. Assay Drug Dev. Technol. 12, 536‒547.
- Ryan, K.R., Sirenko, O., Parham, F., Hsieh, J.H., Cromwell, E.F., Tice, R.R., Behl, M., 2016. Neurite outgrowth in human induced pluripotent stem cell-derived neurons as a high-throughput screen for developmental neurotoxicity or neurotoxicity. Neurotoxicology. 53: 271-81.
- iCell Neurons | Cellular Dynamics. (n.d.). Retrieved June 01, 2017, from http://www.cellulardynamics.com/products/neurons.html